
gnuplot is capable of handling data plotted along a date/time axis and can understand and display dates and times in a variety of formats.
If you are plotting data versus time, you are almost certainly dealing with data tabulated in a file. We have supplied a small file for this recipe called timedat.dat; it consists of a few lines of data, each line containing a date, time, and a number to be plotted. The dates are in the form day/month/2-digit-year, and the times are in the form hour:minute. Following is the first line:
1/1/11 19:00 72.01
The following figure shows plotting with dates using gnuplot:
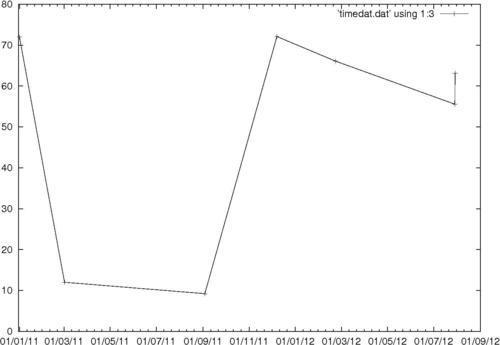
Note that the tics along the bottom axis are labeled as dates.
Following is the script that we used to get the previous figure:
set xdata time
set timefmt "%d/%m/%y %H:%M"
set format x "%d/%m/%y"
plot 'timedat.dat' using 1:3 with linespoints
When dealing with date/time data, you must always alert gnuplot to this with set xdata time. Then you need to tell the program in what format the date and time data will be found; this is the purpose of the set timefmt command. The format string uses %d to stand for the numerical day, %H to stand for the numerical hour using a 24-hour clock, and so on. For a rundown of all the formats that gnuplot understands, type help timefmt at the interactive prompt.
The third line sets the format for the tic labels on the x-axis (which is now a date/time axis). The final line plots the file; the using keyword is mandatory when plotting temporal data.
If you want you can put the time of day in the tic labels as well (and you must if your data lies within one day, for example). Try using the following command:
set format x "%d/%m/%y
%H:%M"
This will get you the date as formatted in the previous figure with the time set below each date. The escape code
in the format specification produces a new line in the label, which puts the time of day below the date.
The use of dates and times in tic labels can take up a lot of horizontal space. gnuplot does a poor job of accounting for space used in tic labels. So, in such situations, we often need to take measures to keep the labels from running into each other. The use of a linebreak embedded in the tic format is one remedy. It may also help to change the font.