
The wireframe splot with hidden line removal that we covered in the first recipe of this chapter, Making a surface plot, gives the visual impression of a solid surface. The numerical value encoded into the surface's height can be visually estimated, roughly, by the perspective provided by the isolines in conjunction with the tics on the vertical axis. But gnuplot also has a way to draw real solid surfaces whose height is indicated by color or shade.
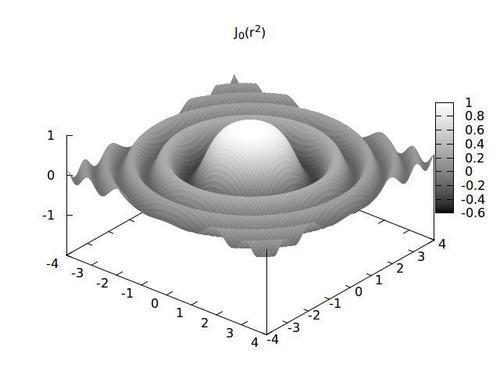
The previous figure shows the same mathematical function plotted in the first recipe in this chapter (Making a surface plot). Now the numerical value of the function at any point is indicated by both the height of the surface and its shade; the surface is now drawn as an opaque membrane rather than as a network of curves.
To produce the previous figure, run the following in gnuplot:
set isosamples 100
set samples 100
unset key
set title "J_0(r^2)"
set xrange [-4:4]
set yrange [-4:4]
set ztics 1
unset surface
set pm3d
splot besj0(x**2+y**2)
The surface will be drawn with a palette of colors when a color output device is being used and with a grayscale palette when using a monochrome terminal.
If you compare the previous script with the one in the Making a surface plot recipe at the beginning of this chapter, you will see that the only significant difference is the highlighted line. The pm3d mode colors the imaginary surface being plotted according to its height or z-value at every point, with the mapping between the height and the color or shade determined by the palette, which we shall discuss in some more detail shortly.
The other modifications are to increase the number of isolines, in order to get a smoother surface, and to turn off the drawing of the individual isolines themselves with the command unset surface. We also need to set the sample frequency; generally we want this to be equal to the isosample frequency. In pm3d mode, the two orthogonal sets of isolines are drawn with two different spacings given by the two parameters. Although the gnuplot manual claims that the global hidden3d setting does not affect pm3d surface plots, it in fact seems to, and should not be turned on, as it appears to slightly degrade the drawing quality.
Sometimes we want both a colored surface and a set of isolines; in fact, this can often be the clearest type of quantitative 3D plot. The way to achieve the highest quality in this type of graph is to use the hidden3d linestyle option to pm3d, as we do in the following script:
set iso 30
set samp 30
unset key
set title "J_0(r^2)"
set xrange [-4:4]
set yrange [-4:4]
set ztics 1
unset surf
set style line 1 lt 4 lw .5
set pm3d at s hidden3d 1
splot besj0(x**2+y**2)
This requires us to define a user linestyle, something we covered in Chapter 3, Applying Colors and Styles. Then the linestyle is referred to in an option to the set pm3d command. This will cause the isolines to be drawn using lines in this style, which allows us to have them in any color, thickness, or pattern supported by our terminal. Further, the isolines will be drawn with hidden line removal, so they will appear to be embedded in the opaque surface. As before, the global hidden3d option should not be turned on.
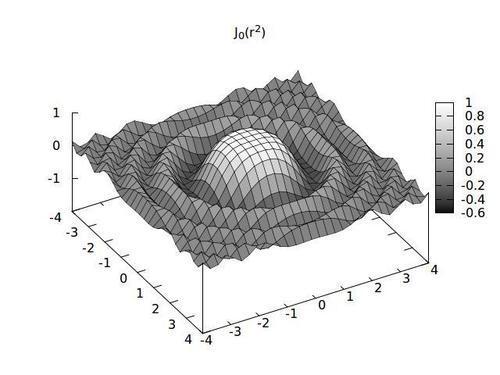
Note that we've also reduced the sample and isoline frequency, to keep our plot from being too crowded with isolines. (The at s component of the set pm3d command means at surface; this will become clearer later in the chapter.)