
If you need an arrangement of figures other than a regular rectangular array, you must specify the origin and size for each plot manually. The following figure provides an example:
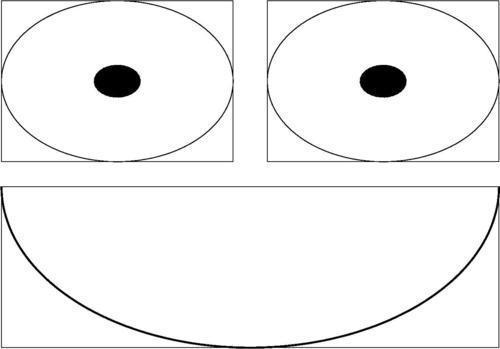
The happy face shown in the previous figure is a simple example of what you can achieve with manual plot positioning; using these commands, figures of frightening complexity can be built up.
The following script shows how to use gnuplot's manual positioning commands:
set multiplot
unset key
unset tics
set polar
set size 1, .5
plot [pi:2*pi] 1 lw 5
set origin 0, .5
set size .5, .5
plot 1 lw 2, .2 with filledcurves
set origin .5, .5
plot 1 lw 2, .2 with filledcurves
unset multiplot
Arbitrary sizing and positioning of individual plots is accomplished using the two new commands that we have highlighted in the previous script. After entering multiplot mode, the set origin command can be used to set the position of the lower-left corner of the next plot. The set size command sets the size of the plot. Both commands use screen coordinates (since there are no coordinate axes to define any other coordinate system) and are passed the x and y coordinates separated by a comma. Unlike the situation when we are using the automatic graph positioning facility introduced in the previous recipe, the order in which we draw the individual plots does not matter, since the absolute position of each one is specified separately. The other commands in the script are familiar from previous recipes; the key and tics were done away with to create a simple, clean figure, and polar coordinates were used to allow us to easily draw circles.
Note that, although we have selected origins and sizes that place the plots touching each other, there seems to be some space between them. This is because gnuplot by default places a margin around each plot, and the command set origin establishes the location of the lower-left corner of the plot including the invisible margin. If we want our plots to be closer together, farther apart, or we would like to adjust the spacing differently in different directions, we must turn to the commands that set the individual margins. These are set bmargin for the bottom margin, set lmargin for the left margin, and so on. (All four margin commands make an appearance in the next recipe.) The coordinate system used in setting these lengths is neither the screen system nor an axis system, but yet another gnuplot coordinate system, the character coordinate system. This is based on the size of a character in the currently chosen font. The use of this coordinate system for margins is rather convenient, as it allows us to relate the thickness of a margin to the size of the tic labels by counting characters.