
gnuplot has built-in a respectable collection of special functions and mathematical operators that allow us to perform significant calculations and massaging of data before plotting. A complete survey of gnuplot's math brain is beyond the scope of this book; interested readers should start with Chapter 13 of the official reference manual distributed with the program and available at http://gnuplot.info/documentation.html.
Here, we shall merely give an example of one very useful technique for plotting functions that have different definitions over different domains; this technique works equally well for functions that are continuous or discontinuous over the entire plotting domain. The example will demonstrate several of gnuplot's mathematical facilities that have not been covered up to now. Following figure is a plot of two functions, a simple sine wave that turns into a decaying sine wave when we cross x = 0:
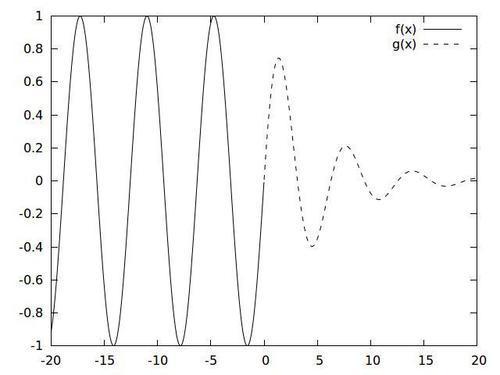
The following script will produce the previous plot:
set samples 2000
f(x) = x < 0 ? sin(x) : NaN
g(x) = x >= 0 ? exp(-x/5.)*sin(x) : NaN
plot [-20 : 20] f(x), g(x)
The highlighted lines contain the new features for this recipe. gnuplot allows us to define our own functions, which can save typing later. The first highlighted line defines a function f(x). Its definition employs the ternary operator, which works in gnuplot similar to the way it works in C and some other programming languages. The structure is C ? A : B, where C is a condition, in this case that x is less than 0. If the condition is true, then A is read and the rest of the structure is skipped; if B is true, then C is read and A is ignored. In the example, f(x) is defined to be sin(x) for negative x and NaN otherwise. NaN stands for Not A Number. gnuplot will not plot anything for NaN, so this is a way to make part of a graph blank; this does what we want, since f(x) is undefined for positive or zero x and we don't want anything plotted there. (Another way to construct an undefined value that will cause gnuplot to not plot anything is to use 1/0 instead of NaN.)
By now it should be clear what the second highlighted line does. It creates a function g(x), which is only defined for nonnegative x, where it is defined as an expression that may be taken to represent a frictionally damped oscillator.
The final line is a familiar plot command that refers to our two user-defined functions. Notice that we have set the number of samples to a fairly large number. This is to avoid having a gap between the two different functions, which do in fact have the same value at x = 0.
Tip
Note on division:
Although we said that we're not going to give a complete course on math in gnuplot, we would like to mention one issue that tends to trip up newcomers, and even some experienced users. In the gnuplot interactive prompt, type print 1/2 and print 5/2. If the results are what you expected, read no farther. If you are surprised, here's what's going on. In the expressions you typed, the numbers were integers, since they had no decimal points. In common with many programming languages, gnuplot returns an integer result when you ask it to do a mathematical operation on integers—and the way it casts a number to an integer is to discard the noninteger component, which has the effect of rounding down. If you want a floating-point result, you need to write at least one of the numbers with a decimal point. For example, 1.0/2 will yield 0.5.