![Using European-style decimals [new]](https://imgdetail.ebookreading.net/cover/cover/data/EB9781849517249.jpg)
Another new internationalization feature in gnuplot 4.4 is the ability to set the character used for the decimal point to be correct for the locale in use. In most European countries the comma is used, whereas in the U.S. the period is conventional.
The following script produces the graph that follows it:
set decimalsign locale "es_ES.utf8"
plot [0:1] x**3
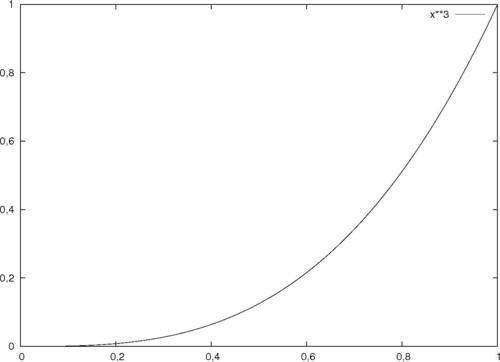
Note that the periods used for decimal points that we've seen in all the examples until now have become commas, because gnuplot knows that that is the convention when using the Spanish language.
The new command set decimalsign selects the correct decimal separator for the locale specified. We can also select any symbol here explicitly. If we would like a vertical bar to stand in for the decimal point, for example, we can say set decimalsign "|". These customizations only affect the output on the graph.