
Certain terminals support enhanced text, which means that they accept a markup language specific to gnuplot that can be used to include characters from various fonts, set subscripts, superscripts, overprint characters, and generally manipulate text with sufficient flexibility to create simple equations to serve as annotations for your graphs. This recipe shows how to make such an equation, but you will see that the markup is cumbersome, and attaining the desired result requires some amount of trial and error. Frankly, a better way to create all but the simplest mathematical text is to use the LaTeX techniques covered in a later chapter, which also leads to a much more attractive output.
However, the enhanced text mode can be useful for quickly placing some mathematical text on your plot, in situations where you are not too picky about the typographical quality of the result.
The following script is similar to the script in the Adding a label with an arrow recipe in this chapter; only the set term command and the label commands have been changed:
set term x11 enhanced
set yrange [-1.5:1.5]
set xrange [0:6.3]
set ytics nomirror
set y2tics 0,.1
set y2range [0:1.2]
set style fill pattern 5
set key at graph .9, .9 spacing 3 font "Helvetica, 14"
set xlabel "Time (sec.)" font "Courier, 18"
set ylabel "Amplitude" font "Courier, 18"
set y2label "Error Magnitude" font "Courier, 18"
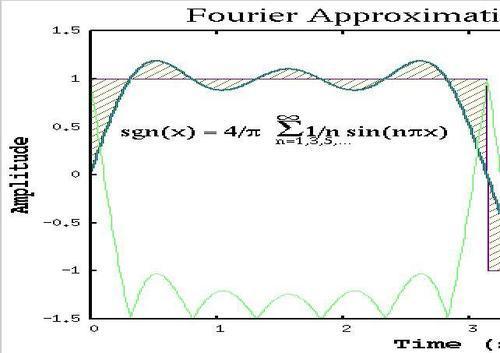
set title "Fourier Approximation to Square Wave" font "Times-Roman, 24"
set label "sgn(x) = 4/{/Symbol p}&{x}~{~@{/Symbol=24 S}{- .5/*.7n=1,3,5,...}}{.9/Symbol=18 245}& {xx}1/n sin(n{/Symbol p}x)" font "Times-Roman, 18" at graph .04, .65
set label "sgn(x) = 4/{/Symbol p}&{x}~{~@{/Symbol=24 S}{- .5/*.7n=1,3,5,...}}{.9/Symbol=18 245}& {xx}1/n sin(n{/Symbol p}x)" font "Times-Roman, 18" at graph .04, .65
plot 'ch2.dat' using 1:2:(sgn($2)) with filledcurves notitle,
'' using 1:(sgn($2)) with lines title "Square Wave",
'' using 1:2 with lines lw 2 title "Fourier approximation",
'' using 1:(abs(sgn($2)-$2)) with lines axis x1y2 title "Error magnitude"
For a full rundown on the markup syntax for enhanced text, type help enhanced at the interactive gnuplot prompt. We'll explain the subset of the syntax we used to create this equation, which gives the Fourier series for a square wave. The /Symbol tags select the Symbol font; p in this font is the Greek letter pi, and S is the capital Greek sigma, meaning sum. The&{xx} notation means to insert a space equal to two "x"s. The notation @X means that the character "X" is to be counted as taking up no space. The notation ~a{.7b} means to overprint a with b raised .7 times the line height; we use it with a construction in curly brackets rather than a single character. The infinity symbol is selected with /Symbol=18 245, which means select character number 245 from the Symbol font at size 18 pt.
Tip
If you find that the markup codes have been copied as written to the graph, rather than interpreted similarly to the figure, then you might have forgotten to say "enhanced" as part of your set term command.
We created this graph with the X11 terminal; experiments with other terminals reveal that the spacing might change, and more trial and error will be needed. This is another reason why the LaTeX methods explained later in the book are preferable, as they create exactly the same output under all conditions.