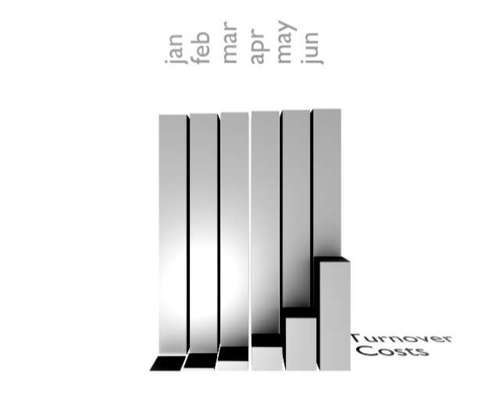
To prove that Blender is adaptable to many tasks besides the interactive creation of 3D graphics, we will show you how to import external data (a spreadsheet in CSV format) and automate the task of creating and rendering the 3D representation of a bar chart.
The idea is to run Blender with arguments directing it to run a script that reads a .csv file, renders an image, and saves that image when finished. For this to be possible we need a way to call Blender with the correct parameters. We get to that script shortly, but first let's see how to pass parameters to Blender to make it run a Python script:
blender -P /full/path/to/barchart.py
It is also possible to run a script from a text buffer inside a .blend file by naming that text buffer instead. Notice the order of the parameters in this case—the .blend file comes first:
blender barchart.blend -P barchart.py
We also need a way to specify arguments to pass to our script. In contrast to what is described in the API docs, we can just access the command-line arguments from Python like this:
import sys
print sys.argv
This last snippet will print all arguments, including the name of the Blender executable as the first. Our script will have to skip any arguments intended for Blender itself when using this list. Any arguments intended only for our script that shouldn't be interpreted by Blender itself should come after an end-of-options argument, the double minus (--).
Finally, we don't want Blender to pop up and show an interactive GUI. Instead, we will instruct it to run in the background and exit when done. This is done by passing the -b option. Putting all this together, the command line will look like this:
blender -b barchart.blend -P barchart.py - data.csv
If Blender is run in background mode you must specify a .blend file, otherwise Blender will crash. If we have to specify a .blend file we can use an internal text as our Python script just as well, otherwise we'd have to keep two files together instead of one.
Here, we show the relevant parts of the code in chunks (the complete file is available as barchart.blend that has barchart.py as an embedded text). We start by creating a new World object and set its zenith and horizon colors to a neutral all white (highlighted part of the following code):
if __name__ == '__main__':
w=World.New('BarWorld')
w.setHor([1,1,1])
w.setZen([1,1,1])
Next, we retrieve the last argument passed to Blender and check whether the extension is that of a .csv file. Real world production code would have more sophisticated error checking of course:
csv = sys.argv[-1]
if csv.endswith('.csv'):
If it has the correct extension we create a new Scene named BarScene and set its world attribute to our newly created world (This was inspired by a much more elaborate script by jessethemid on Blender Artists http://blenderartists.org/forum/showthread.php?t=79285). The background mode does not load any default .blend file so the default scene will not contain any objects. However, just to make sure, we create a new empty scene with a meaningful name that will hold our objects:
sc=Scene.New('BarScene')
sc.world=w
sc.makeCurrent()
Then, we pass the filename to a function that adds the barchart objects to the current scene and returns the center of the chart so that our addcamera() function can use it to aim the camera. We also add a lamp to make rendering possible (otherwise our render would be all black).
center = barchart(sys.argv[-1])
addcamera(center)
addlamp()
The rendering itself is straightforward (we will encounter more elaborate examples inChapter 8, Rendering and Image Manipulation). We retrieve the rendering context that holds all information about how to render, for example which frame, what output type, the size of the render, and so on. And, because most attributes have sensible defaults, we just set the format to PNG and render.
context=sc.getRenderingContext()
context.setImageType(Scene.Render.PNG)
context.render()
Finally, we set the output directory to an empty string to make our output go to the current working directory (the directory we were in when we called Blender) and save our rendered image. The image will have the same basename as the .csv file that we passed as the first argument but will have a .png extension. We checked that the filename ends in .csv so it's safe to bluntly strip the last four characters from the filename and add .png
context.setRenderPath('')
context.saveRenderedImage(csv[:-4]+'.png')
Adding a lamp is not much different from adding any other object and is very similar to the "hello world" example. We create a new Lamp object, add it to the current scene, and set its location. A Lamp object has of course many configurable options but we settle for a default non-directional lamp in this example. The highlighted code shows some typical Python idiom: loc is a tuple of three values but setLocation() takes three separate arguments so we indicate we want to unpack the tuple as separate values with the * notation:
def addlamp(loc=(0.0,0.0,10.0)):
sc = Scene.GetCurrent()
la = Lamp.New('Lamp')
ob = sc.objects.new(la)
ob.setLocation(*loc)
Adding a camera is a little more intricate as we have to point it to our bar chart and make sure that the view angle is wide enough to see everything. We define a perspective camera here and set a fairly wide angle. Because the default camera is already oriented along the z-axis we do not have to set any rotation, just set the location 12 units removed from the center along the z-axis as highlighted in the second last line of the following code:
def addcamera(center):
sc = Scene.GetCurrent()
ca = Camera.New('persp','Camera')
ca.angle=75.0
ob = sc.objects.new(ca)
ob.setLocation(center[0],center[1],center[2]+12.0)
sc.objects.camera=ob
The barchart function itself is not much of a surprise. We open the passed-in filename and use the standard csv module from Python to read the data from the file. We store all column headers in xlabel and other data in rows.
from csv import DictReader
def barchart(filename):
csv = open(filename)
data = DictReader(csv)
xlabel = data.fieldnames[0]
rows = [d for d in data]
In order to scale our bar chart to reasonable values we have to determine the extremes of the data. The first column of each record holds the x-value (or label) so we exclude that from our calculation. As each value is stored as a string we have to convert it to a floating point value for comparisons.
maximum = max([float(r[n]) for n in data.fieldnames[1:] for r in rows])
minimum = min([float(r[n]) for n in data.fieldnames[1:] for r in rows])
To create the actual bars we iterate over all rows. Because the x-value might be a textual label (such as the name of a month for example), we keep a separate numerical x-value in order to position the bars. The x-value itself is added to the scene as a Text3d object by the label() function, whereas the y-values are visualized by appropriately scaled Cube objects added by the bar() function. Neither the label() nor the bar() function are shown here.
for x,row in enumerate(rows):
lastx=x
label(row[xlabel],(x,10,0))
for y,ylabel in enumerate(data.fieldnames[1:]):
bar(10.0*(float(row[ylabel])-minimum)/maximum,(x,0,y+1))
x = lastx+1
Finally, we label each column (that is, each set of data) with its own column header as a label. We stored the number of x-values so we can return the center of our bar chart by dividing it by two (the y component is set to 5.0 as we scaled all y-values to lie within the range 0-10).
for y,ylabel in enumerate(data.fieldnames[1:]):
label(ylabel,(x,0,y+0.5),'x')
return (lastx/2.0,5.0,0.0)
Tip
A Windows trick: SendTo
Once you have your .blend file containing a correct Python script and you have figured out the correct way to invoke it from the command line, you can integrate this more closely with Windows XP by creating a SendTo program. A SendTo program (a .BAT file in this case) is any program that will take a single filename as an argument and acts upon it. It has to reside in the SendTo directory—which may be located in different places depending on your system configuration. It is simple to find by clicking on the Start button, selecting Run, and typing sendto instead of a command. This will open the correct directory. In this directory you can place the .BAT file, in our case we call it BarChart.BAT, and it will contain a single command: /full/path/to/blender.exe /path/to/barchart.blend -P barchart.py -- %1 (note the percent sign). Now we can simply right-click any .csv file we encounter and we can then select BarChart.BAT from the SendTo menu and hey presto, a .png file will appear alongside our .csv.