
10.4.4 Reactor Design
Our next step is to express the partial pressures PT, PB, and PH2 as a function of X, combine the partial pressures with the rate law, ![]() , as a function of conversion, and carry out the integration of the packed-bed design equation
, as a function of conversion, and carry out the integration of the packed-bed design equation
![]()
Example 10-2. Catalytic Reactor Design
The hydrodemethylation of toluene is to be carried out in a PBR catalytic reactor.
![]()

The molar feed rate of toluene to the reactor is 50 mol/min, and the reactor inlet is at 40 atm and 640°C. The feed consists of 30% toluene, 45% hydrogen, and 25% inerts. Hydrogen is used in excess to help prevent coking. The pressure drop parameter, α, is 9.8 × 10⁻⁵ kg–1.
a. Plot and analyze the conversion, the pressure ratio, y, and the partial pressures of toluene, hydrogen, and benzene as a function of PBR catalyst weight.
b. Determine the catalyst weight in a fluidized CSTR with a bulk density of 400 kg/m3 (0.4 g/cm3) to achieve 65% conversion.
a. PBR with pressure drop
- Mole Balance:
E10-2.1

- Rate Law: From Equation (E10-2.1) we have
E10-2.2

with k = 0.00087 mol/atm2/kg cat/min, KB = 1.39 atm–1, and KT = 1.038 atm–1.
- Stoichiometry:
E10-2.3
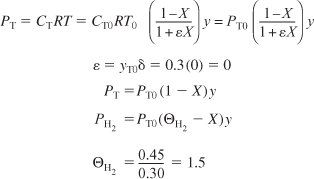
E10-2.4

E10-2.5

Because ε = 0, we can use the integrated form of the pressure drop term.
4-33

Pressure drop in PBRs is discussed in Section 5.5.
Note that PT0 designates the inlet partial pressure of toluene. In this example the inlet total pressure is designated P0 to avoid any confusion. The inlet mole fraction of toluene is 0.3 (i.e., yT0 = 0.3), so that the inlet partial pressure of toluene is
PT0 = (0.3)(40) = 12 atm
We now calculate the maximum catalyst weight we can have, such that the exiting pressure will not fall below atmospheric pressure for the specified feed rate. This weight is calculated by substituting the entering pressure of 40 atm and the exiting pressure of 1 atm into Equation (5-33), i.e.,

- Evaluate: Consequently, we will set our final weight at 10,000 kg and determine the conversion as a function of catalyst weight up to this value. Equations (E10-2.1) through (E10-2.5) are shown in the Polymath program in Table E10-2.1. The conversion is shown as a function of catalyst weight in Figure E10-2.1, and profiles of the partial pressures of toluene, hydrogen, and benzene are shown in Figure E10-2.2. We note that the pressure drop causes the partial pressure of benzene to go through a maximum as one traverses the reactor.
Table E10-2.1. Polymath Program and Output

Figure E10-2.1. Conversion and pressure ratio profiles.

Figure E10-2.2. Partial pressure profiles.
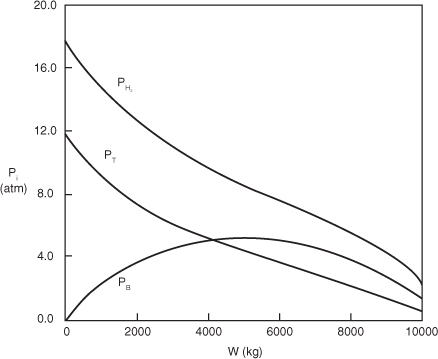
PBR Analysis: For the case of no pressure drop, the conversion that would have been achieved with 10,000 kg of catalyst would have been 79%, compared with 68.2% when there is pressure drop in the reactor. To carry out this calculation use the living example program and simply multiply the pressure drop parameter by zero, i.e., line (5) would read α = 0.00098*0. For the feed rate given, eliminating or minimizing pressure drop would increase the production of benzene by up to 61 million pounds per year! Finally, we note in Figure E10-2.2 that the partial pressure of benzene (PB) goes through a maximum. This maximum can be explained by recalling that PB is just the product of the benzene mole fraction (xB) times the total pressure (P) [i.e., PB = xBP]. Near the middle to end of the bed, benzene is no longer being formed so that xB stops increasing. However, because of the pressure drop, the total pressure decreases and, as a result, so does PB.
b. Fluidized CSTR
We will now calculate the fluidized CSTR catalyst weight necessary to achieve the same (ca.) conversion as in the packed-bed reactor at the same operating conditions. The bulk density in the fluidized reactor is 0.4 g/cm3. The design equation is


Analysis: This example used real data and the CRE algorithm to design a PBR and CSTR. An important point is that it showed how one could be embarrassed by not including pressure drop in the design of a packed-bed reactor. We also note that for both the PBR and fluidized CSTR, the values of the catalyst weight and reactor volume are quite high, especially for the low feed rates given. Consequently, the temperature of the reacting mixture should be increased to reduce the catalyst weight, provided that side reactions and catalyst decay do not become a problem at higher temperatures.
Example 10-2 illustrated the major activities pertinent to catalytic reactor design described earlier in Figure 10-6. In this example the rate law was extracted directly from the data and then a mechanism was found that was consistent with experimental observation. Conversely, developing a feasible mechanism may guide one in the synthesis of the rate law.