
Linear dimensionality reduction projects the original data onto a lower-dimensional hyperplane that aligns with informative directions in the data. The focus on linear transformations simplifies the computation and echoes common financial metrics, such as PCA's goal to capture the maximum variance.
However, linear approaches will naturally ignore signal reflected in non-linear relationships in the data. Such relationships are very important in alternative datasets containing, for example, image or text data. Detecting such relationships during exploratory analysis can provide important clues about the data's potential signal content.
In contrast, the manifold hypothesis emphasizes that high-dimensional data often lies on or near a lower-dimensional non-linear manifold that is embedded in the higher dimensional space. The two-dimensional swiss roll displayed in the screenshot at the beginning of this section illustrates such a topological structure.
Manifold learning aims to find the manifold of intrinsic dimensionality and then represent the data in this subspace. A simplified example uses a road as one-dimensional manifolds in a three-dimensional space and identifies data points using house numbers as local coordinates.
Several techniques approximate a lower dimensional manifold. One example is locally-linear embedding (LLE), which was developed in 2000 by Sam Roweis and Lawrence Saul and used to unroll the swiss roll in the previous screenshot (see examples in the manifold_learning_lle notebook).
For each data point, LLE identifies a given number of nearest neighbors and computes weights that represent each point as a linear combination of its neighbors. It finds a lower-dimensional embedding by linearly projecting each neighborhood onto global internal coordinates on the lower-dimensional manifold, and can be thought of as a sequence of PCA applications.
Visualization requires the reduction to at least three dimensions, possibly below the intrinsic dimensionality, and poses the challenge of faithfully representing local and global structure. This challenge relates to the increasing distance associated with the curse of dimensionality. While the volume of a sphere expands exponentially with the number of dimensions, the space in lower dimensions available to represent high-dimensional data is much more limited.
For example, in 12 dimensions, there can be 13 equidistant points, but in two dimensions there can only be three that form a triangle with sides of equal length. Hence, accurately reflecting the distance of one point to its high-dimensional neighbors in lower dimensions risks distorting the relations among all other points. The result is the crowding problem: to maintain global distances, local points may need to be placed too closely together, and vice versa.
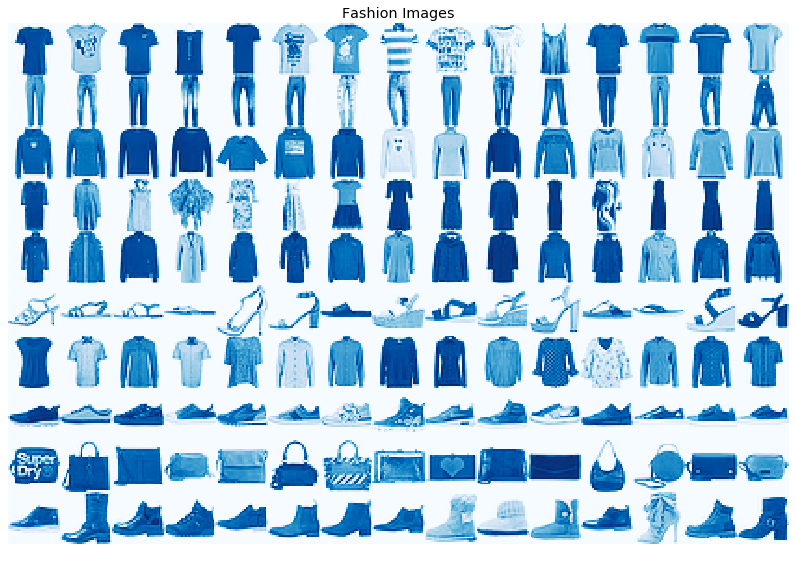
The following two sections cover techniques that have made progress in addressing the crowding problem for the visualization of complex datasets. We will use the fashion MNIST dataset, a more sophisticated alternative to the classic handwritten digit MNIST benchmark data used for computer vision. It contains 60,000 train and 10,000 test images of fashion objects in 10 classes (see following samples):
The goal of a manifold learning algorithm for this data is to detect whether the classes lie on distinct manifolds, to facilitate their recognition and differentiation.