
The visualization shows that requiring tokens to appear in at least 1% and fewer than 50% of documents restricts the vocabulary to around 10% of the almost 30,000 tokens.
This leaves a mode of slightly over 100 unique tokens per document (left panel), and the right panel shows the document frequency histogram for the remaining tokens:
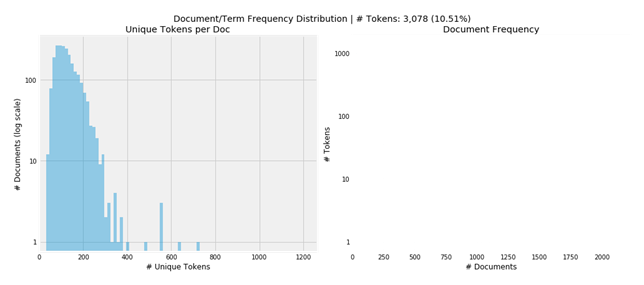
Documents/Term frequency distribution