5.3 ISOLATED BLOCK DIAGRAM REPRESENTATION OF SINGLE AREA FREQUENCY CONTROL
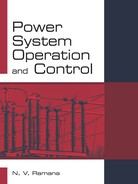
- Speed governing system: (Fig 4.3 is redrawn as Fig 5.3a)
Kg = Governor gain constant
Tg = Governor time constant
∆PC (S) = speed changer setting
∆XT (S) = change in position at point T in linkage mechanism
- Turbine model representation: (Fig 4.4 is redrawn as Fig 5.3b)
Kt = Turbine gain constant
Tt = Turbine time constant
power flow in the power system:
- Generator load model representation: (Fig 4.5 is redrawn as Fig 5.3c)
Kp = Power system gain
Tp = Power system time constant
∆F (S) = Change in frequency
∆PD (S) = Change in power demand.
Models for turbine, speed governor, power system are obtained. In practice a single generator rarely feeds a large area. Several generators located at different places are connected in parallel, to supply the power needs of a geographical area. Normally, all these generators may have the same response characteristics for the changes in load demand. In such a case, it is called as a control area.
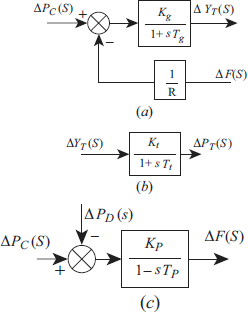
Fig 5.3 Block diagram representation of governor, turbine and generator-load models
By combining Figs 5.3 (a, b, c) the block diagram representation for single area control may be shown as in Fig 5.4, where, ∆PG (S) = ∆PT (S)
Fig 5.4 Single area load frequency control model