
As mentioned earlier, there are several choices of tools to use for NAV report layout development. The specific screen appearance depends somewhat on which tool is being used.
To begin our report development work in Visual Studio, we must have our C/SIDE dataset definition open in Design mode. Then navigate to View | Layout to open up Visual Studio. If we have previously done Visual Studio development work on this report and saved it, that work will be displayed in Visual Studio, ready for our next effort. In this case, since we are just starting, we will see the following screenshot:
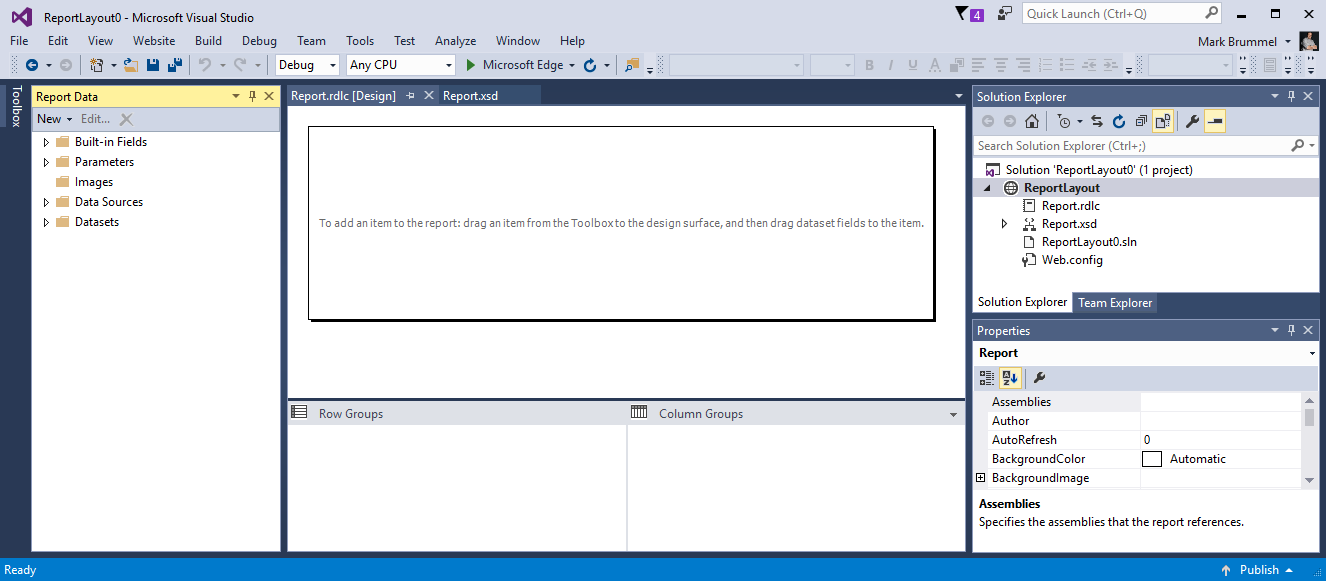
On the left of the screen is a tab labeled Toolbox. When we click on that tab, the window shown in the following screenshot will be displayed:

Since we want a page header, let's start by adding that to our layout. Right-click on the Report menu, then click on Add Page Header as shown in the following screenshot. Note that if we want the Report Header to appear on each page, we must use the SetData and GetData functions in association with hidden text boxes (see How to: Print Report Header Information on Multiple Pages- https://msdn.microsoft.com/en-us/dynamics-nav/how-to--print-report-header-information-on-multiple-pages):

Next, we will add some fields to the Page Header. First, we will expand two of the categories in the Report Data panel that is on the left side of our layout screen. The two categories we want to expand are parameters, which contains our captions we checked, plus any defined Labels, and DataSets, which contains the data elements passed from our Report Designer, all seen in the following screenshot:

When we expand the DataSet Result, we can see the importance of our data field Names being self-documenting. Having done so makes it much easier to remember what we defined in our DataSet and with which DataItems they are associated. This habit will be especially important when we have multiple fields with the same name from different DataItems, such as Code, Description, or Amount.
The DataSet represents a record format in which all defined fields are present for all DataItems. This is a classic flat file format where the hierarchical data structure is flattened out to make it easier to pass from one environment (NAV) to another; in this case, Visual Studio.
Now we will add the report title that we defined as a label earlier in the Report Designer. Drag the Report Title field over to the Page Header workspace and position it where we want it to be. Now, expand the Built-in Fields section in the Report Data panel. We will add some of these fields, such as User ID, Execution Time, and Page Number to our Page Header. We will position these fields wherever we think appropriate.
At this point, it's a good time to save our work and test to see what we have done so far by performing the following steps:
- Click on the top-left File menu option, or the disc icon, or Ctrl + S to save the design as RDLC.
- Click on the File menu option, then on Exit or the X box at the top right of the screen (or Alt + F4) to return to the Report Designer.
- Exit the Report Dataset Designer.
- Respond Yes to the The layout of report id 50001 has changed...Do you want to load the changes? question.
- Then we'll see a familiar window asking us Do you want to save Report 50001 Shows by Type?. Save and compile the report.
Now Run the report. The Preview output should look something like in the following screenshot:
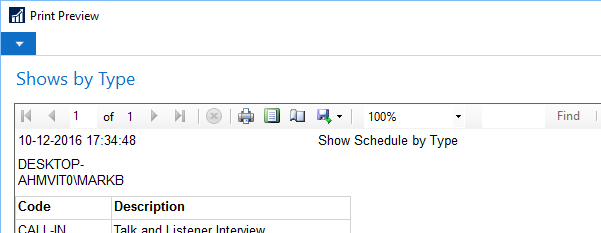
Not especially impressive, but not bad if this is our first try at creating a NAV 2017 report.
The wrapped report fields show us that we need to make those text boxes wider. This would be a good point to do some experimenting with positioning or adding other heading information, such as Page, in front of the page number. When we highlight a field, the properties of that field are displayed, and are available for modification in the Properties window. A few simple changes and our Report Heading could look like the following screenshot:

We could even experiment with various properties of the heading fields, choosing different fonts, bolding, colors, and so on. As we only have a small number of simple fields to display (and could recreate our report if we have to do so), this is a good time to learn more about some of the report appearance capabilities that Visual Studio provides.