
From the Edit-Session list screen, we have two options to attach the Debugger session to a session. One way is to highlight a Session and then click on the Debug icon, as shown in the following screenshot:

The other way is to click on the Debug Next icon, then initiate a new Session, as shown in the following screenshot. The Debugger will be attached to the new Session:
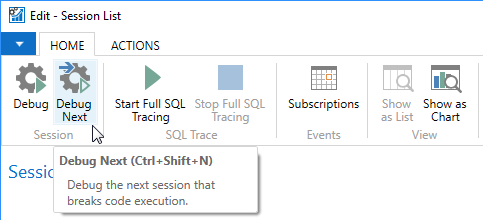
When we click on Debug Next, an empty View - Debugger page will open, awaiting the event that will cause a break in processing and the subsequent display of Code detail (Code), Watched variables (Watches), and the Call Stack:
