
EXAMPLE 6 Overlay G3D Surfaces
Purpose: Overlay multiple 3D surfaces in the same plot.
One of the limitations of the SAS/GRAPH PROC G3D surface plot is that it allows you to plot only a single surface. A colleague in grad school had a need to plot two surfaces on the same set of axes, and I devised a way to do that using PROC GREPLAY. The technique is fairly straightforward, but there are a few caveats.
The data is not really important (you’ll have your own data); therefore, I use the following data, which I borrowed from a SAS/GRAPH example:
data raw_data;
input X Y Z;
datalines;
-1.0 -1.0 15.5
-.5 -1.0 18.6
.0 -1.0 19.6
.5 -1.0 18.5
1.0 -1.0 15.8
-1.0 -.5 10.9
-.5 -.5 14.8
.0 -.5 16.5
.5 -.5 14.9
1.0 -.5 10.9
-1.0 .0 9.6
-.5 .0 14.0
.0 .0 15.7
.5 .0 13.9
1.0 .0 9.5
-1.0 .5 11.2
-.5 .5 14.8
.0 .5 16.5
.5 .5 14.9
1.0 .5 11.1
-1.0 1.0 15.8
-.5 1.0 18.6
.0 1.0 19.5
.5 1.0 18.5
1.0 1.0 15.8
;
run;
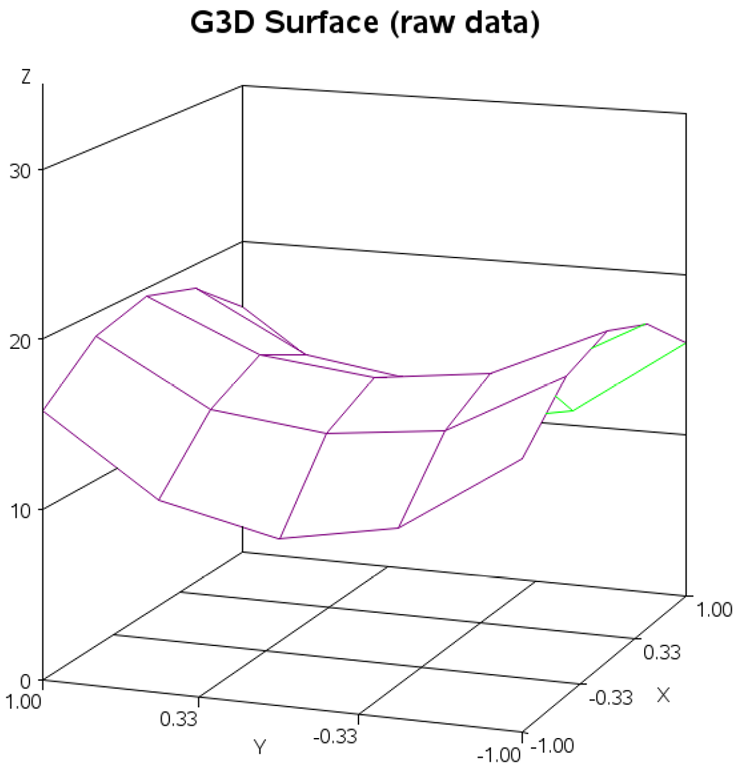
The raw data contains only 25 data points. Therefore, PROC G3D would produce only the following low-resolution surface (with 25 vertices), which is somewhat lackluster.
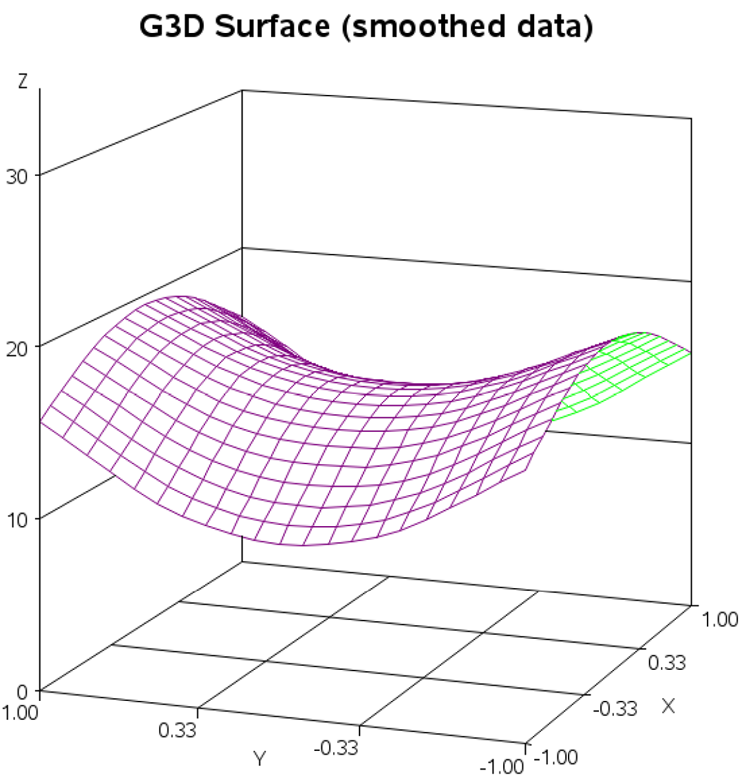
To give PROC G3D more points to work with (and produce a smoother higher-resolution plot), you will want to run the data through PROC G3GRID. This uses a smoothing algorithm, and interpolates extra data points along the smoothed surface. The following PROC G3GRID settings, for example, produce a data set containing 441 “smoothed” data points along the surface.
proc g3grid data=raw_data out=smoothed;
grid y*x=z / spline smooth=.05
axis1=-1 to 1 by .1
axis2=-1 to 1 by .1;
run;
If you were now to plot the smoothed data, the resulting surface plot would look much nicer:
For this example, I need data for two surfaces. To keep the example simple, I am just re-using the same data for both surfaces (applying a +/-8 offset in the Z direction). Of course, you will be using your real data, rather than using this trick to create fake data for the second surface.
data smoothed; set smoothed;
label z1='Z' z2='Z';
z1=z-8;
z2=z+8;
run;
Now I am ready to start creating the real plots. I create a separate plot for each surface, and later use PROC GREPLAY to display both surfaces together.
You will want everything in both plots to be in the exact same locations, except for the 3-D surfaces (this includes both the text and the axes). Also, as you are creating these individual plots, turn off the displaying of graphs (using the NODISPLAY GOPTION) so they will not be written out until you do the final GREPLAY.
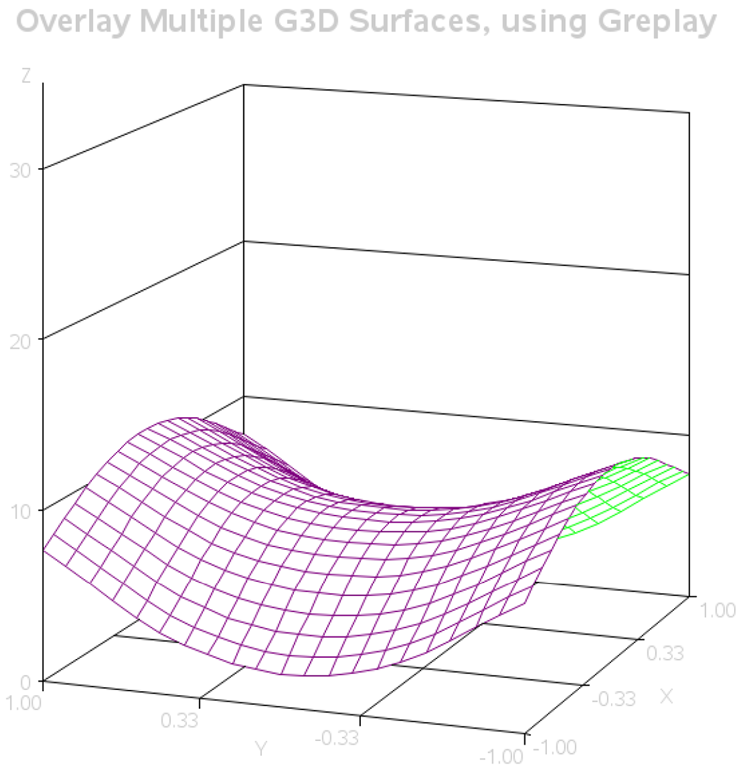
In addition to having all the text and axes in exactly the same positions in both plots, here is a little caveat that most people do not know: if you overlay two plots that both have anti-aliased black text (that is, smoothed edges), then the anti-aliasing is combined and produces a “fuzzy” halo-effect around the text. To avoid this problem, you can make the text on the first plot white (same color as the background). You might want to make the text light gray while you are experimenting with the code and getting everything lined up just right (as shown below), but when you are ready to create the final graph, change it to white. Here is the code for the first plot (PLOT1).
goptions nodisplay;
goptions ctext=white;
title ls=1.5 "Overlay Multiple G3D Surfaces, using GReplay";
proc g3d data=smoothed;
plot y*x=z1 /
grid zmin=0 zmax=30 xticknum=4 tilt=80
ctop=purple cbottom=cx00ff00 name="plot1";
run;
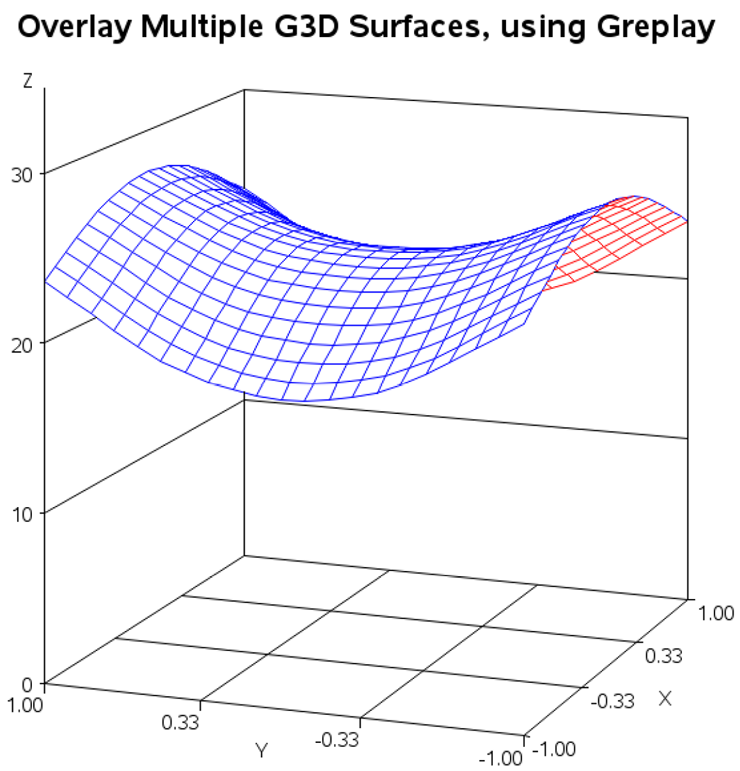
The code for the second plot (PLOT2) is very similar, but with black text:
goptions ctext=black;
proc g3d data=smoothed;
plot y*x=z2 /
grid zmin=0 zmax=30 xticknum=4 tilt=80
ctop=blue cbottom=red name="plot2";
run;
Now that you have created both plots, and stored them as named GRSEG entries (PLOT1 and PLOT2), you can overlay the two graphs on the same page using PROC GREPLAY. The following code creates a GREPLAY template with one area that covers the entire page (0,0 to 100,100). The area is called area number 1, and I TREPLAY PLOT1 and PLOT2 into each into area (1:plot1 1:plot2).
goptions display;
proc greplay tc=tempcat nofs igout=work.gseg;
tdef WHOLE des="my template"
1/llx=0 lly=0
ulx=0 uly=100
urx=100 ury=100
lrx=100 lry=0
;
template = whole;
treplay 1:plot1 1:plot2;
run;

One issue to keep in mind: the G3D surfaces are generated as solid surfaces (blocking out everything behind them), but when you overlay them using GReplay, one copy of the axes is printed on top of the surface. This makes the surface look transparent when it comes to the axis, but not transparent when it comes to the surface crossing over itself. Most people will not notice this problem, but it is a limitation you should be aware of. Also, this trick is probably viable only for plotting two separate (non-overlapping and non-intersecting) surfaces.