
EXAMPLE 19 Drill-down Link to an HTML Anchor
Purpose: Create maps (or graphs) with HTML drill-down functionality, and have those drill-down links go to HTML anchors on the same page--all done in a data-driven manner.
One of the most useful features of SAS/GRAPH is the ability to create output containing HTML hotspots with data-driven drill-down functionality. When you view the output in a Web browser, you can click on these hotspots (corresponding to bars, pie slices, plot markers, or as in this case, map areas) and drill down to more detailed information.
It goes without saying that the easiest drill-down functionality to implement are links to pages that someone else maintains because you do not have to create the pages you drill down to. However, we do not usually have the luxury of someone else maintaining the exact drill-down pages we need, so we usually have to create our own. In the case of the U.S. map, you need to maintain 50 drill-down maps, one for each state. That is a lot of maps to maintain; therefore, you will of course want to automate that task.
This example demonstrates how to create the U.S. drill-down map, and automate the creation of the 50 individual state drill-down maps (using a macro). And as a bonus, it also demonstrates how to place all the maps in a single HTML page (rather than having a separate HTML page for each map), and have each map tagged as with an anchor that can be linked to.
Note that you can easily modify this code to work with other maps, or even other graphs; the technique is not limited to the U.S. map.
To begin, we need some data. Since the Census data is readily available, and everyone can relate to plotting population on maps, I am using year 2000 Census data from http://www.census.gov/popest/counties/files/CO-EST2004-ALLDATA.csv.
Here is some code to read in the Census CSV data file containing the population data:
PROC IMPORT OUT=pop_data DATAFILE="CO-EST2004-ALLDATA.csv" DBMS=CSV REPLACE;
GETNAMES=YES;
DATAROW=2;
GUESSINGROWS=1000;
RUN;
U.S. Map
For each state, I create a variable with an HTML data tip and drill-down link. The HTML TITLE= tag is the data tip (which displays when you move your cursor over the area in a Web browser), and the HTML HREF= tag specifies the URL to drill down to when the state is clicked.
Rather than using a normal URL, I am specifying an HTML anchor tag, which is a # followed by the state name (such as #Alaska). When you click on this link, it will jump to the #Alaska HTML anchor on your current page, which I will have added at the location of the Alaska map.
data pop_data; set pop_data;
length state_html $300;
state_html=
'title='||quote(trim(left(stname))||'0d'x
||trim(left(put(census2000pop,comma20.0))))||
' href='||quote('#'||trim(left(stname)));
run;
I subset just the state totals into a STATE_DATA data set, so I can plot them on the U.S. map:
proc sql;
create table state_data as
select * from pop_data
where sumlev=40;
quit; run;
Now we can create the U.S. map, with hover text and drill-down links for each state, using the following code. For the HTML tags to work, you must generate the output using ODS HTML, and you must view the output using a Web browser.
%let name=census_map;
filename odsout '.';
ODS LISTING CLOSE;
ODS HTML path=odsout body="&name..htm";
legend1 position=(right middle) label=(position=top font="albany amt/bold" "Population")
shape=bar(.15in,.15in) value=(justify=center) across=1;
pattern1 v=s c=cxEDF8FB;
pattern2 v=s c=cxB3CDE3;
pattern3 v=s c=cx8C96C6;
pattern4 v=s c=cx8856A7;
pattern5 v=s c=cx810F7C;
title1 ls=1.5 "Year 2000 U.S. Census";
proc gmap data=state_data map=maps.us;
format census2000pop comma20.0;
id state;
choro census2000pop / levels=5
coutline=black legend=legend1
html=state_html
des='' name="&name";
run;
quit;
ODS HTML CLOSE;
ODS LISTING;
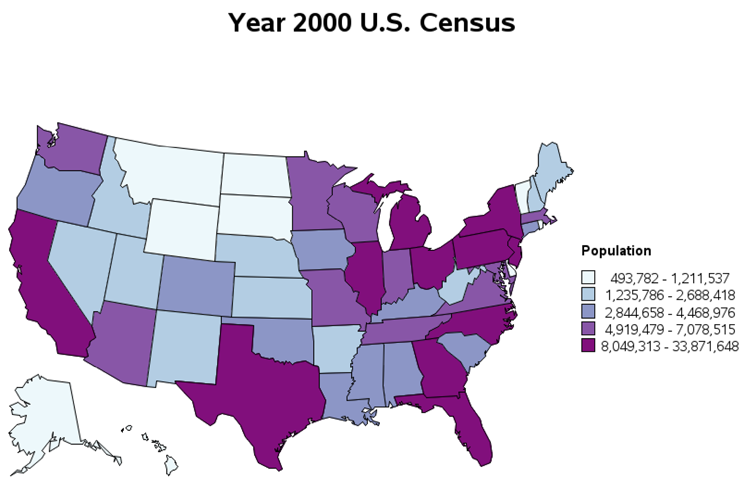
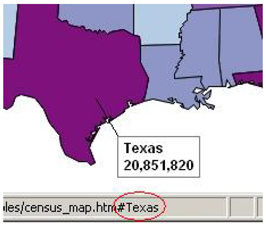
And now, when you view this U.S. map in a Web browser and move your cursor over a state, you will see the state name and population displayed, and when you click on the state it will drill down to the HTML anchor (on the same Web page) for that state. For example, the HTML anchor for Texas is #Texas. Note that in some browsers (such as Internet Explorer), the drill-down URL will display in the status bar along the bottom edge of the browser, as in the figure below. I have circled the anchor part of the URL so you can see it easily:
State Maps
In order for those drill-down links to have something to actually drill down to, we need to create an individual map for each state (with an HTML anchor). The individual state maps will be shaded by the population of each county. First we will need the county data for each state, and we will set up HTML TITLE= tags with data tips showing the county name and population (but with no HREF= drill-down URLs for these individual state maps).
proc sql;
create table county_data as
select * from pop_data
where sumlev=50;
quit; run;
data county_data; set county_data;
length county_html $300;
county_html=
'title='||quote(trim(left(ctyname))||'0d'x
||trim(left(put(census2000pop,comma20.0))));
run;
To create the individual state maps, you could copy and paste PROC GMAP code 50 times, and edit a WHERE statement each time to create each of the 50 different state maps. That, however, is a lot of work and a lot of code to maintain.
Instead, I prefer to programmatically loop through the data and call a macro to generate each map.
First I create a data set called LOOPDATA containing one observation for each state, and then I set up a DATA step to loop through all the states and call the %DO_STATE macro once for each state (passing in the state’s name to the macro). I insert this code just after the U.S. PROC GMAP code and before the ODS HTML CLOSE so that all these individual state maps are appended onto the same Web page as the U.S. map.
proc sql noprint;
create table loopdata as
select unique stname
from state_data;
quit; run;
data _null_; set loopdata;
call execute('%do_state('|| stname ||'),'),
run;
Of course, you will need a %DO_STATE macro, and you must declare this macro before you can use it. For that reason, I put this code at the top of the program.
The macro will need to write out an HTML anchor for the desired state (using an ODS statement)=, and then subset that state out of the U.S. county map. It will then plot that state’s population data on the map. Below is a simplistic approach—a bit overly simple, but a good starting point to help you get a grasp on how everything works together.
Also note that I am using the state name (&STNAME) as part of the NAME=, so the PNG file will have a meaningful name (such as census_map_alabama.png).
%macro do_state(stname);
ods html anchor="&stname";
title1 ls=1.5 "Year 2000 &stname Census";
proc gmap
data=county_data (where=(stname="&stname"))
map=maps.uscounty (where=(fipnamel(state)="&stname")) all;
format census2000pop comma20.0;
id state county;
choro census2000pop / levels=5
coutline=black legend=legend1 html=county_html
des='' name="&name._&stname";
run;
%mend do_state;
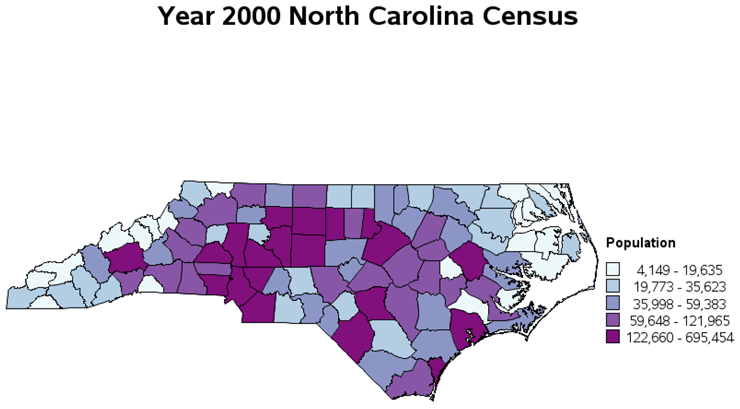
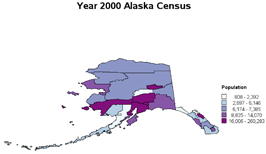
The above code uses the pre-projected MAPS.USCOUNTY, and simply subsets the desired state out of that map. Although this technique is simple, it produces state maps that visually look crooked. The projection (or orientation) of each state might look okay when displayed in the context of the whole U.S., but not so great when the states are displayed individually.
In order to make each state look good when plotted individually, you will need to project each state individually, using PROC GPROJECT. You have to use MAPS.COUNTIES (rather than MAPS.USCOUNTY) because you need unprojected latitude and longitude values to use with PROC GPROJECT. Once you have projected the map, you can plot it with PROC GMAP just like you normally would.
%macro do_state(stname);
ods html anchor="&stname";
proc gproject data=maps.counties (where=(fipnamel(state)="&stname")) out=state_map
project=robinson nodateline;
id state county;
run;
title1 ls=1.5 "Year 2000 &stname Census";
proc gmap data=county_data (where=(stname="&stname")) map=state_map all;
format census2000pop comma20.0;
id state county;
choro census2000pop / levels=5
coutline=black legend=legend1 html=county_html
des='' name="&name._&stname";
run;
%mend do_state;
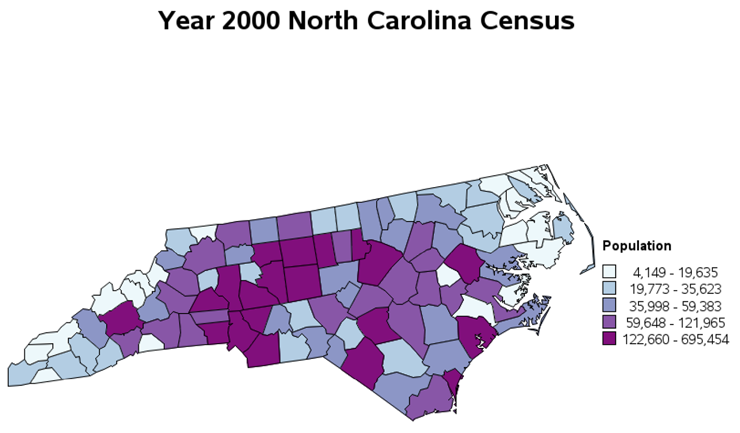
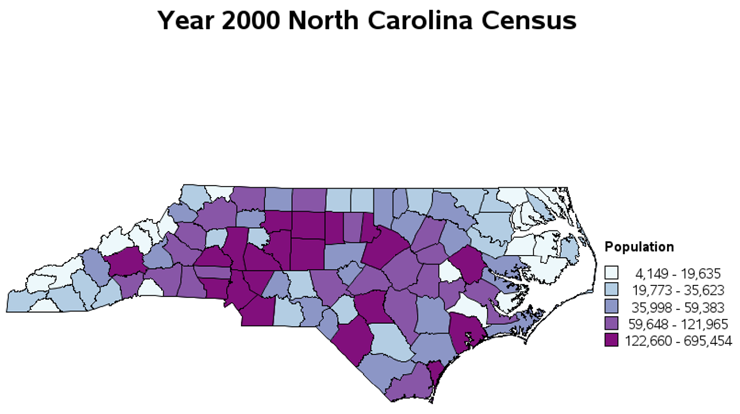
Here is the projected North Carolina map:
As you loop through the macro, it appends an HTML anchor, followed by the individual state map. The following shows a few anchors and states. For illustration, I have made the anchors visible so that you can see what is going on. The HTML anchors are not visible in the SAS HTML output when the actual output is viewed in a Web browser, of course.
![]()

![]()
![]()
Now, when we put it all together, the SAS job first creates a U.S. map, and then appends under the U.S. map the pairs of HTML anchors and state maps for each state. When you view the HTML output, you start at the top (viewing the U.S. map) and when you click on a state in the U.S. map, you drill down to the HTML anchor for the selected state.
This technique is very useful with many types of data. And you do not have to use a map. You could use the same technique with bar charts, pie charts, scatter plots, or even tables.