
EXAMPLE 7 Adding Border Space
Purpose: Describe tricks that can be used to add the desired amount of white space on all sides of a graph.
Of all the SAS/GRAPH tricks that I use, this is probably the one I use most frequently.
It is often very useful to be able to control the amount of white space on the top, bottom, left, and right of a graph. One way to do that is to use blank TITLE and FOOTNOTE statements. In this example, I use a very simple bar chart to demonstrate the technique, but do not let the simplicity of the bar chart over-shadow the power of the technique I will be using to control the white space.
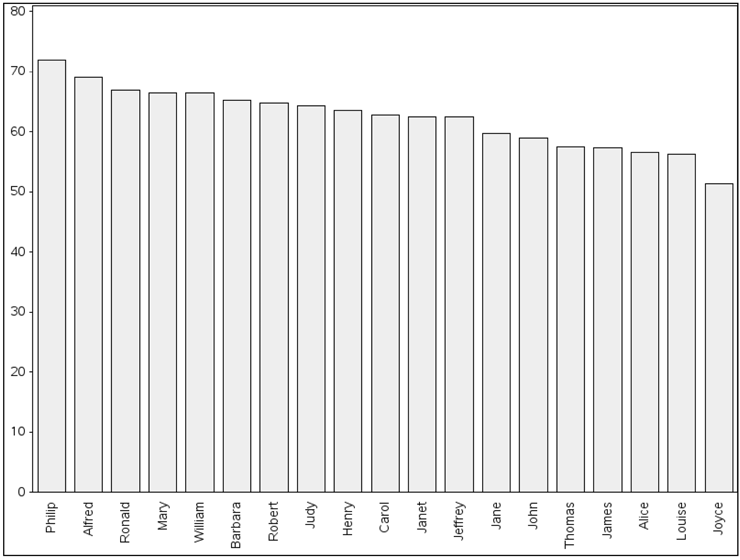
Here is the code for the simple default bar chart:
axis1 label=none minor=none;
axis2 label=none value=(angle=90);
pattern1 v=solid color=grayee;
proc gchart data=sashelp.class;
vbar name / type=sum sumvar=height descending
raxis=axis1 maxis=axis2;
run;
By default, SAS/GRAPH output tends to try to fill all the available space. But sometimes this does not produce a “visually appealing” graph — it looks a bit crowded with so little white space around the borders.
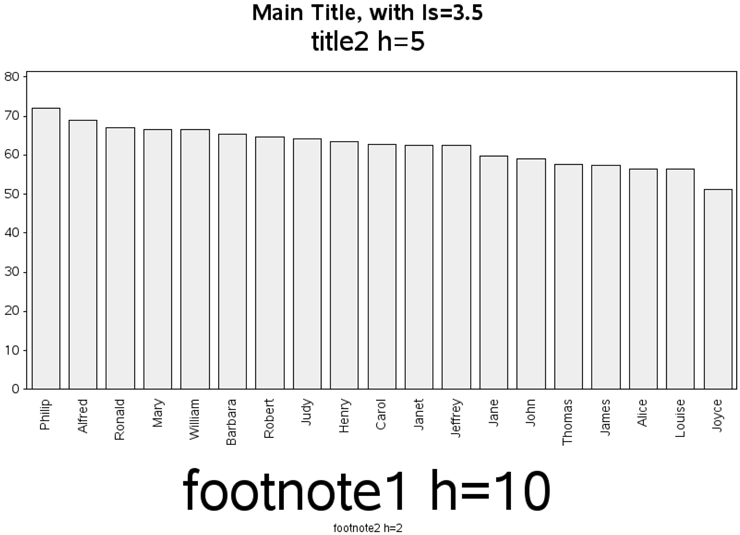
You can use “blank” title and footnote statements to add extra white space.
When using this technique, I typically specify that goptions gunit=pct, and specify the height of these blank titles as a percent of the page. You can also specify the height in points. I prefer percent, however, because that makes it easier to change the size of the graph without having to modify the code. In addition to the text height, you can also specify a large LS= value (line spacing) on the title. For now, I am using visible text in the titles, to show you the height value I used and let you see how much space that text occupies. (At the end I will also show the graph with blanked-out text.)
goptions gunit=pct ftitle="albany amt/bold" ftext="albany amt";
title1 ls=3.5 "Main Title, with ls=3.5";
title2 h=5 "title2 h=5";
footnote1 h=10 "footnote1 h=10";
footnote2 h=2 "footnote2 h=2";
Did you know that you can specify angle=90 for the title, and the title text is positioned along the left side of the graph? And, of course, if that title is blank, it will add white space to the left of the chart.
title1 h=7 a=90 "h=7 a=90";
footnote;

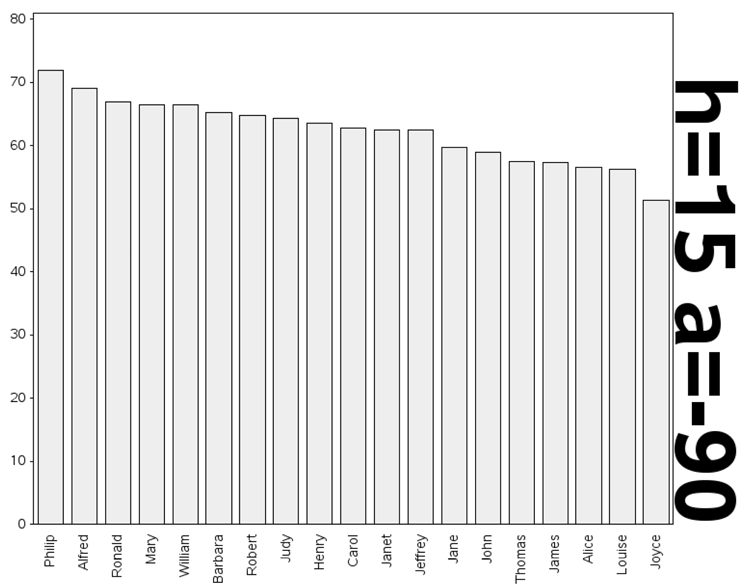
Similarly, if you specify angle=-90, it will position the title on the right side of the graph.
title1 h=15 a=-90 "h=15 a=-90";
footnote;
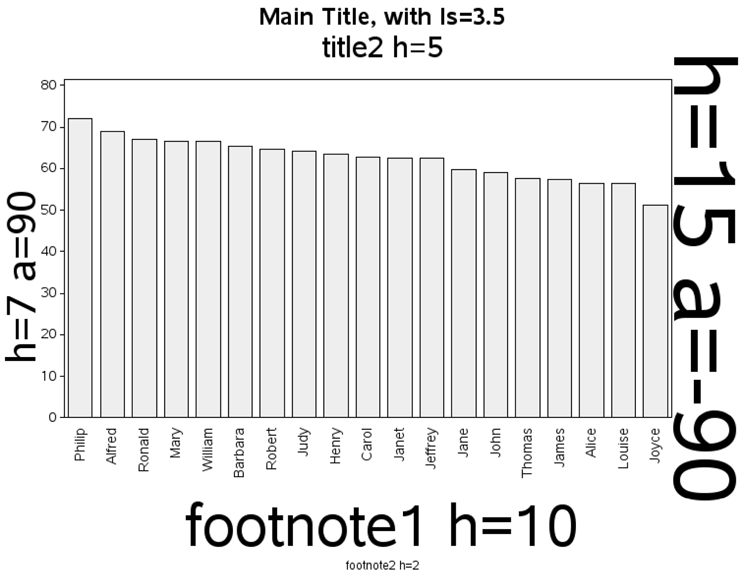
Now, here is the graph with all of the previous titles and footnotes, so you can see the combined effect:
title1 ls=3.5 "Main Title, with ls=3.5";
title2 h=5 "title2 h=5";
title3 h=7 a=90 "h=7 a=90";
title4 h=15 a=-90 "h=15 a=-90";
footnote1 h=10 "footnote1 h=10";
footnote2 h=2 "footnote2 h=2";
And if you make the text blank, here is the white space added by all those blank titles and footnotes. This is a little more white space than you would normally want, but I am adding extra-large spaces to exaggerate the effect and make it easier to see.
title1 ls=3.5 "Same Graph, with Blank Titles";
title2 h=5 " ";
title3 h=7 a=90 " ";
title4 h=15 a=-90 " ";
footnote1 h=10 " ";
footnote2 h=2 " ";

Let me repeat: of all the SAS/GRAPH tricks that I use, this is probably the one I use most frequently.