
EXAMPLE 22 Using SAS/IntrNet with Graphs
Purpose: Demonstrate how to use SAS/IntrNet to generate a graph on the fly.
Sometimes it is impractical to create all the thousands of graphs a user might want ahead of time. And sometimes the user might want the graphs to contain the latest and greatest data available. Both of these scenarios can be solved by creating the graphs on the fly using SAS/IntrNet.
When a user navigates to a SAS/IntrNet URL, this triggers a SAS job to run on the server, and the graph is generated and displayed to the user in their browser. If needed, parameters can be passed on the URL, and the values of these parameters can be used in the SAS job to tell the job how to subset the data and so on.
There are entire books that cover all aspects of installing and configuring SAS/Intrnet, such as Building Web Applications with SAS/IntrNet, by Don Henderson. Therefore, I will not attempt to cover all those details in this short example. I will assume that you already have a SAS/IntrNet server up and running, and this example describes how to create a program that takes some user input (parameters on the URL) and generates a graph corresponding to that input.
The Biorhythm Example
No doubt, most of you have heard of biorhythms, the supposed cycles of 28, 33, and 23 days that determine your emotional, intellectual, and physical well-being. The biorhythm cycles are illustrated in the chart below. (See the color image on the Web site to discern the three colored lines.)
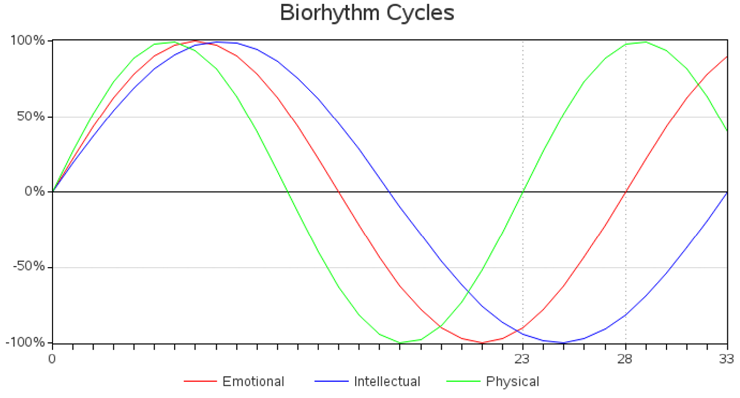
On any given day, your location on each of those three cycles can be mathematically calculated. This example demonstrates how to do that graphically. Since each user will have a different birth date, and the current day changes from day to day, this subject is a perfect candidate for a graph to be dynamically generated via SAS/IntrNet.
When SAS/IntrNet is installed, the administrator will set up a location for your SAS jobs and also a URL you can use to run those jobs. The URL will look something like the following but with your site’s Web server URL and your site’s values rather than appdev92 and ctntest.
http://sww.sas.com/sww-bin/broker9?_service=appdev92&_program=ctntest.{job-specific stuff}
For this biorhythm example, my SAS job is named bio.sas, and the parameter that is passed in (and becomes a macro variable in the SAS job) is called BIRTHDATE. The complete URL to pass in the BIRTHDATE and run the bio.sas job at my site is:
http://sww.sas.com/sww-bin/broker9?_service=appdev92&_program=ctntest.bio.sas&birthdate=27nov1964
Here is the basic structure I use for a SAS/IntrNet job that creates a graph. You can basically use any traditional SAS/GRAPH procedure in there, and it produces ODS HTML output (complete with HTML data tips and HTML drill-down links, if your job uses those). Assuming that the job does not have to do a lot of number crunching, the graphs are usually
generated in one or two seconds (depending on the speed of the server, for example). There is very little overhead, and the graphs are generated very quickly.
/* subset data, and/or do calculations, based on the passed-in parameter(s) */
ods listing close;
ods html body=_webout path=&_tmpcat (url=&_replay) rs=none style=minimal;
/* run your SAS/GRAPH proc(s), such as Proc GPlot */
quit;
ods html close;
The following is the complete SAS code for this SAS/IntrNet job (bio.sas). Since the focus of this example is SAS/IntrNet, rather than PROC GPLOT, I do not go into a lot of details explaining the PROC GPLOT code, which is pretty standard.
First I set some graphics options that do such things as: make sure it uses graphical text characters (GOPTIONS characters), set device to PNG, specify the nice smooth-edged Albany AMT font (especially important if the server is on UNIX), set desired XPIXELS and YPIXELS size for the PNG file, and so on.
The important thing pertaining to SAS/IntrNet is that I take the date parameter (BDATE) that was passed in on the URL and use it to control the graph. I stuff it into a temporary data set (called FOO), and create BDATE and TODAY macro variables (containing the numeric SAS date values). I then calculate a STARTDATE and ENDDATE that are +/– 30 days from today. I loop from STARTDATE to ENDDATE, and calculate the biorhythm values for physical, emotional, and intellectual cycles on each day, and plot those values using PROC GPLOT.
ods listing close;
ods html body=_webout path=&_tmpcat (url=&_replay) rs=none style=minimal;
goptions cback=white characters device=png border;
goptions gunit=pct htitle=5.5 htext=3.5 ctext=gray33 ftitle="albany amt" ftext="albany amt";
goptions xpixels=700 ypixels=375;
/* convert the text date into a sas numeric date, and put it into a macro variable, and also put today's date (and +/- 30 days) into macro variables. */
data foo;
bdate="&birthdate"d;
call symput('bdate',bdate);
today=today();
call symput('today',today);
startdate=today-30;
enddate=today+30;
call symput('startdate',startdate);
call symput('enddate',enddate);
run;
/* calculate biorhythm values along the 3 lines for each date */
data mydata;
length id $15;
format date date9.;
format value percentn7.0;
d2r=(atan(1)/45); /* degrees to radians conversion factor */
do Date = &startdate to &enddate by 1;
t=Date-&bdate; /* days since birth */
Value = sin((t/23)*360*d2r); id='Physical'; output;
Value = sin((t/28)*360*d2r); id='Emotional'; output;
Value = sin((t/33)*360*d2r); id='Intellectual'; output;
end;
run;
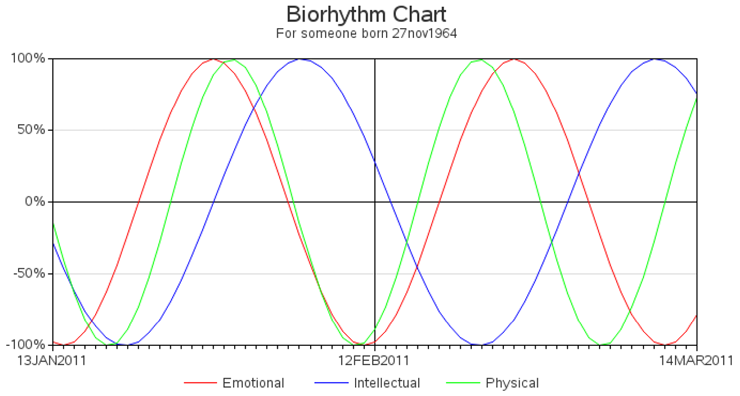
title1 ls=1.5 "Biorhythm Chart";
title2 "For someone born &birthdate";
axis1 label=none order=(-1 to 1 by .50) value=(color=gray33 h=3.5) minor=none offset=(0,0);
axis2 label=none order=(&startdate to &enddate by 30) value=(color=gray33 h=3.5) minor=(number=29) offset=(0,0);
symbol1 color=red i=join value=none width=1;
symbol2 color=blue i=join value=none width=1;
symbol3 color=cx00ff00 i=join value=none width=1;
legend1 label=none position=(bottom center) across=3;
proc gplot data=mydata;
plot Value*Date=id /
vref=(-.5 0 .5) cvref=(graydd black graydd)
href=(&today) chref=(black)
vaxis=axis1 haxis=axis2
legend=legend1 cframe=white;
run;
quit;
ods html close;
Below is a snapshot of some sample output:
Other Possibilities for SAS/IntrNet
For the biorhythm chart, I take the passed-in date and the current date to generate the data to plot, but SAS/IntrNet has many other uses.
For example, you could pass in a value, use that value to subset your data using a WHERE clause, and then plot the results. You can also pass in multiple parameters on the URL: just separate them with ampersands (&). Or, sometimes you do not need to pass in any parameters at all. You just want to get the latest data each time the SAS/IntrNet job is run.
Also, while I did not get into it in this example, there are many ways to get the values from the user, and create the URL with those values included as the parameters. Many people use simple HTML forms or a Flash-based client. Others programmatically build the URLs in another SAS/GRAPH job, and when you click to drill down in that SAS/GRAPH output, the drill down links are the URLs that run a SAS/IntrNet job (with each bar’s value as the parameter), and so on.