
Preface
A wise man once said:
“A motivated SAS/GRAPH programmer can create just about any graph.”
In this book, I try to give you the knowledge and inspiration to be that programmer.
These days, anybody can create a simple graph. Many companies provide software with a simple GUI (Graphical User Interface) that enables users to point-and-click their way through a gallery of graphs, select which variables to plot, and produce a mediocre graph.
Given how easy it is to make them, you might ask, “How can I make my graphs stand out?”
A lot of people fall into the trap of trying to make their graphs stand out by being fancier. They add bright colors, three-dimensional effects, images in the background, and sometimes make the charts fade-in, spring-up, or oscillate before coming to a rest where you can finally read them. But fancier is not necessarily better, and in the case of graphs, such fancy additions usually make the graph more difficult to read and quickly comprehend, so making the graph fancier can actually make the graph worse rather than better.
I encourage you to make your graphs stand out by being better, rather than fancier. And by better, I mean graphs that show the data more clearly, and make it easier for people to look at the graph and quickly answer the questions the graph was created to answer in the first place. And in order to do that, you will need to learn to customize your graphs.
That is where SAS/GRAPH comes in. Whereas most software provides only a GUI interface that enables you to create the graphs that are pre-programmed, SAS/GRAPH provides a programming framework that enables you to customize every aspect of the graphs. It even enables you to create totally new and unique graphs.
Very few people take the time to learn how to create better graphs through customization, and therefore knowing how to do this will give you a great competitive advantage.
Purpose of This Book
The purpose of this book is to go way beyond the basics, and teach you how to create your own custom graphs, not just to modify the look of the graphs, but to create your own graphs with totally unique geometry, layouts, and so on.
Target Audience
The target audience for this book is the SAS/GRAPH programmer who has a firm grasp of the basics and is motivated to learn more.
When I say “programmer,” I mean someone who writes SAS programs. The techniques described in this book require programming, and in order to utilize and modify these techniques to produce your own unique custom graphs, you will need to understand the programming tricks.
In addition to SAS/GRAPH programming, you will also need to be comfortable with data manipulation. You will often need to transpose, de-normalize, or otherwise restructure your data to get it to work with the various SAS/GRAPH procedures.
Also, creating clever annotate data sets is a very important part of creating custom graphs. Annotate is a way of letting you programmatically add text or graphics to a graph in SAS. You store the annotation functions in a SAS data set, and each observation in the data set contains one command. For example, “at this X/Y coordinate, do this thing.”
Software Used in This Book
First, you will need to be comfortable manipulating data using SAS tools such as the following.
- DATA step
- PROC SQL
- PROC TRANSPOSE
- various functions to manipulate text variables (TRIM, LEFT, SCAN, SUBSTR, and so on)
Of course, you do not need to know everything about those tools, but you will at least need to be well versed with the basics and be comfortable using them.
In addition to those data manipulation tools, you will also need to be comfortable with the following, at least on a basic level:
- using ODS HTML and device=png for creating Web output
- macro variable substitution
- running a simple macro and passing a parameter to it (in a few examples)
The examples in this book primarily use the following SAS/GRAPH procedures.
- PROC GPLOT
- PROC GCHART
- PROC GMAP
- PROC GSLIDE
- PROC GREPLAY
Time will be spent explaining how to use PROC GREPLAY (since most users probably have not used it before), but since you should already have a good basic understanding of the other procedures, the basics will not be explained in this book.
Software Not Used in This Book
A single book cannot cover everything, and here is a list of a few things related to SAS/GRAPH that are not covered in this book:
- Java and ActiveX output.
- The SAS 9.2 graphics that use the ODS GRAPHICS ON statement (also referred to as ODS Statistical Graphics or SAS/STAT graphs).
- The SAS 9.2 procedures based on the Graph Template Language (GTL) such as the SGPLOT and SGPANEL procedures.
- Graph procedures that do not produce a GRSEG entry (that is, cannot be used with the GREPLAY procedure).
- SAS/GRAPH procedures that do not support annotation.
Although the Java and ActiveX versions of the SAS/GRAPH graphs are interesting and fun, they do not support all the methods that can be used to create custom graphics. Many of the procedure options are only partially supported, you cannot use PROC GREPLAY with them, and you cannot use the GTITLE and GFOOTNOTE options (placing title text within the graph area—see Example 7). I rely on all of these things for my custom graph “tricks.”
The new ODS Statistical Graphics and GTL-based SAS graphs are typically designed to produce nice graphs for a special target audience out-of-the-box, and do not require (or allow) extensive customizations. They allow you to change the “look” of the graphs, but not the geometry itself so that you can come up with new or unique graphs.
And since PROC GREPLAY and the Annotate facility are the major customization techniques described in this book, any graphical procedure that does not support those is not used in these examples. This would include some of the new SAS/GRAPH procedures such as PROC GKPI, PROC GAREABAR, and PROC GTILE.
My One SAS/GRAPH Program
I jokingly tell people that although I have been a SAS programmer for over 18 years, I have written only one SAS program: I just keep modifying it. To a large extent, that is actually true.
Here I describe the basic shell I use for all my SAS/GRAPH examples. All the samples in this book are coded using this same basic technique. I always say that there are 10 different ways to do things in SAS. You do not have to write your SAS/GRAPH programs this way, but I would strongly encourage you to at least consider these techniques. They have served me well over the years.
I assign a macro variable called NAME at the top of the job, and then I use that as the name of the HTML output file (in the ODS statement), and also as the name of the PNG output file (in the DES= option). I set a filename called “odsout” to “.” (the current working directory) and use that as my ODS HTML path so that both the HTML output and the PNG graphics file are written there. Of course, you can use any folder you want, such as “C:Someplace” instead of “.”, if you prefer.
Note that I also name my .sas job by this same name, so that both the SAS job and the output it produces have the same name; this makes it easy to keep the files organized. For example, the following (pseudo-code) would be stored in a file named foo.sas, and it would produce the output in foo.png and foo.htm:
%let name=foo;
filename odsout '.';
goptions device=png;
ODS LISTING CLOSE;
ODS HTML path=odsout body="&name..htm";
proc whatever data=mydata;
someplot / des="" name="&name";
run;
quit;
ODS HTML CLOSE;
ODS LISTING;
As far as the order of things, I generally work with my data first (IMPORT, SUMMARIZE, TRANSPOSE, and so on), and then turn on my ODS statements just before I want to write out my output. This way, I do not have to do things to suppress output when I am manipulating the data, such as use the NOPRINT option in PROC SQL.
These days I find that the most useful and flexible type of output is created using the ODS HTML statement, which produces output that is suitable for viewing on the Web. You can easily view your output with a Web browser (either on your local file system or on a Web server), and you can easily share it with others (they need only a Web browser to view it). Also, you can add tooltips and drill-down functionality to pieces of the graphs, which is very useful.
I specify device=png in all my examples. If you are wanting to create custom graphs, I strongly recommend that you do not use device=java or device=activex. They do not support all the SAS/GRAPH procedure options (see the “partially supported” notes throughout the reference manual), and they do not support PROC GREPLAY at all. I choose PNG over GIF, mainly because PNG supports 16 million colors, whereas the GIF standard has a limit of 256. Also, the SAS cutting-edge new development and new features are focused on PNG rather than GIF.
I typically use GOPTIONS statements to control the font and size of the text, so I can easily control that in one place, and I typically specify gunit=pct so I can specify font sizes as a percent of the height of the page. This way, if I make the graphs larger or smaller, the text is automatically resized accordingly. I will occasionally specify the font size in points (such as htext=10pt) if I specifically want the text to be that point size, no matter how big or small I make the graph. Specifying point size is sometimes useful for publications that require all text to be in a certain size.
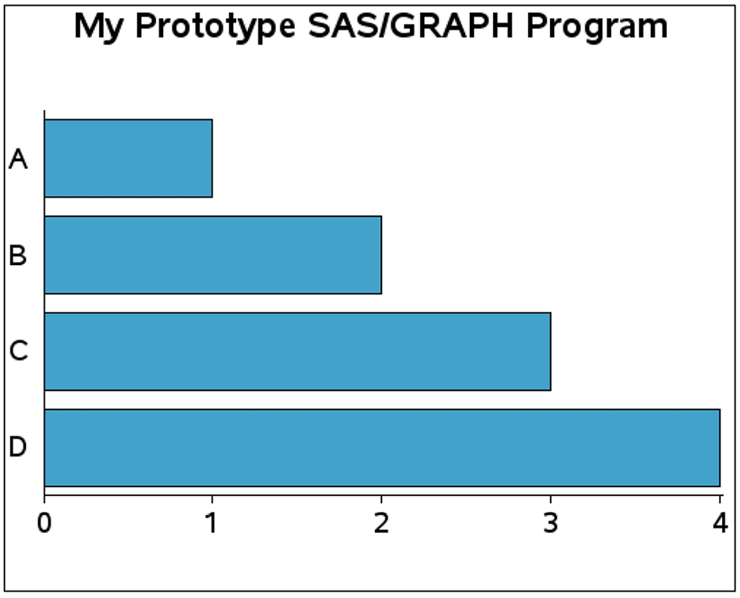
And I generally find that using the GOPTIONS XPIXELS and YPIXELS to control the size of the output is the best way to go. Below is a simple program that demonstrates most of the techniques described above:
%let name=prototype_graph_program;
filename odsout '.';
data mydata;
input category $ 1-1 value;
datalines;
A 1
B 2
C 3
D 4
;
run;
goptions device=png;
goptions xpixels=500 ypixels=400;
ODS LISTING CLOSE;
ODS HTML path=odsout body="&name..htm" (title="Prototype Graph") style=sasweb;
goptions gunit=pct htitle=6 ftitle="albany amt/bo" htext=5 ftext="albany amt";
axis1 label=none;
axis2 label=none minor=none;
pattern v=solid color=cx43A2CA;
title1 "My Prototype SAS/GRAPH Program";
proc gchart data=mydata;
hbar category / type=sum sumvar=value
nostats noframe
maxis=axis1
raxis=axis2
des="" name="&name";
run;
quit;
ODS HTML CLOSE;
ODS LISTING;
Running the Graph Code
If you are reading an online copy of the book, you could hypothetically copy and paste the code from the book into your SAS editor. But I recommend you download the SAS code in its entirety from the author’s Web site (see “Author Pages” below), and run the complete program, rather than trying to run the bits and pieces of code as I try to explain what each piece does. Many of the fragments of code depend on other fragments of code having been run first, and perhaps other macro variables and other settings that were performed earlier in the full code version (but not shown in the book, for brevity). Also, sometimes I do not explain the pieces of code in the exact same order they appear in the actual program.
It might surprise you to hear that I recommend you run your SAS/GRAPH jobs in batch mode, and I strongly recommend that as the best way to develop custom graph code.
You could run your code in the standard interactive DMS (Display Management System) SAS interface, but you would continually have to reset your graphics options, delete your GRSEGS entries, and so on, and also try to decide whether you are looking at the graph from the current run or the previous run. At a minimum, you should probably add the following to the top of all your programs to reset your goptions and delete all the GRSEGS entries if you run them in DMS:
goptions reset=all;
%macro delcat(catname);
%if %sysfunc(cexist(&catname)) %then %do;
proc greplay nofs igout=&catname;
delete _all_;
run;
%end;
quit;
%mend delcat;
%delcat(work.gseg);
By comparison, when you run each of your jobs in a separate batch run (as I recommend), you are guaranteed a clean start each time, and only the options and settings that you specifically set in your code are the ones that are controlling the appearance of your custom graphs.
You could also run your SAS/GRAPH jobs in SAS Enterprise Guide (EG), but you would first need to remove the hardcoded ods html and so on from my sample code. And you would still have similar problems as with DMS SAS, wondering whether the results you see are based on the code you are currently running, or a combination of that and the code you previously ran. EG also tries very hard to make you use ActiveX, colorful ODS styles, and the NOGTITLES option (that is, the titles are separate text outside the graph). Therefore, you will need to do a lot of work to change the EG defaults before you can generate custom graphs.
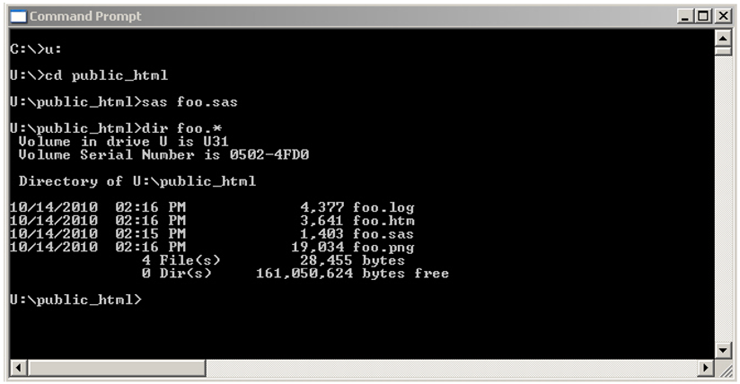
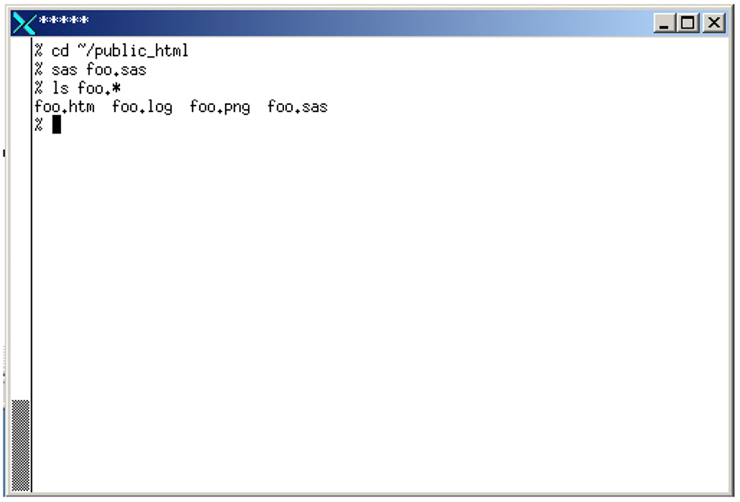
To run a SAS job in batch, I just make sure the SAS executable is in my search path, cd to the directory (or folder) containing the SAS job (such as foo.sas), and then run sas foo.sas from the command prompt. The output .htm and .png files are written to the current directory as well as the SAS log.
Here is an example on a PC:
Here is an example on UNIX:
To write my code, I use whatever editor I want to edit the .sas file (usually the vi editor on UNIX) instead of using the SAS program editor in DMS SAS. And I view the .log file in another window using the ‘vi’ editor or a file browser. (I do not get the benefit of the DMS SAS color-coding, but I generally find the WARNING and ERROR messages in the log point me in the right direction.)
I edit the .sas file in one window, submit the ‘sas foo.sas’ in another window (using “command line recall” so I do not have to type the same command over and over), and view the HTML or PNG output in a Web browser. And I iteratively repeat, over and over, until the graph is as close to perfect as it can get.
Just some background information—both my PC and UNIX computers can access the same (multi-protocol) file server and therefore I usually edit my code from UNIX, and submit the code from my PC. I do this because I am most comfortable with the UNIX editor and file management, and because I prefer PC SAS (my PC typically has more fonts that I can use in my SAS jobs, and the pre-production versions of SAS are available on PCs first, since that is the main development platform). I encourage you to choose the platforms that will be most convenient to you.
You do not have to edit your SAS jobs outside of DMS SAS, and submit your SAS/GRAPH jobs in batch, but I find it to be a very useful and flexible way to work, especially when writing custom graphs.
Delivering and Viewing Your Output
I strongly encourage you to view your output in a Web browser.
While you can generally view files in your local file system (that is, any file system that your computer can access) by using the file system path in your browser, I recommend using a “proper” Web server, if possible (ideally, on the Web server where your output will be delivered to your users). This will help you make sure the interactivity of your graphs is working, and that your drill-down paths do not contain any absolute pathnames to files on your local drive. Also, putting your output on a real Web server makes it easy to share with others by sending them a URL.
In my case, I have a public_html folder which I can access directly from Windows or UNIX, and everything under that public_html folder can be viewed through the Web server on our intranet via a Web browser.
If you cannot deliver your output to your users via a Web server, one alternative is to E-mail it to them. If your output does not use any HTML tooltips or drill-down functionality, you could simply mail them the .png file. If your output uses HTML tooltips or drill-down functionality, then you will need to mail both the .png and the .htm file, and they will have to save them to the disk, and then view it in their browser.
Author Pages
Each SAS Press author has an author page, which includes several features that relate to the author including a biography, book descriptions for coming soon titles and other titles by the author, contact information, links to sample chapters and example code and data, events and extras, and more. You can access the author pages from http://support.sas.com/authors.
You can access the example programs for this book by linking to http://support.sas.com/publishing/authors/allison_robert.html. Select this book, and then click Example Code and Data.
If you are unable to access the code through the Web site, send e-mail to [email protected].
Additional Resources
SAS offers you a rich variety of resources to help build your SAS skills and explore and apply the full power of SAS software. Whether you are in a professional or academic setting, we have learning products that can help you maximize your investment in SAS.
|
Bookstore |
|
|
Training |
In the bookstore, you might specifically be interested in “Maps Made Easy Using SAS.” Per training courses, you might find the following courses useful: “SAS/GRAPH 1: Essentials” and “Producing Maps with SAS/GRAPH.”
|
Knowledge Base |
|
|
Support |
|
|
Learning Center |
|
|
Community |
http://support.sas.com/community/ sas_graph_and_ods_graphics |
Comments or Questions?
If you have comments or questions about this book, you may contact the author through SAS as follows:
Mail:
SAS Institute Inc.
SAS Press
Attn: Robert Allison
SAS Campus Drive
Cary, NC 27513
E-mail: [email protected]
Fax: (919) 677-4444
Please include the title of the book in your correspondence.
For a complete list of books available through SAS Press, visit support.sas.com/publishing.
SAS Publishing News:
Receive up-to-date information about all new SAS publications via e-mail by subscribing to the SAS Publishing News monthly eNewsletter. Visit support.sas.com/subscribe.