
2.6.2 Space Velocity
The space velocity (SV), which is defined as
![]()
might be regarded at first sight as the reciprocal of the space time. However, there can be a difference in the two quantities’ definitions. For the space time, the entering volumetric flow rate is measured at the entrance conditions, but for the space velocity, other conditions are often used. The two space velocities commonly used in industry are the liquid-hourly and gas-hourly space velocities, LHSV and GHSV, respectively. The entering volumetric flow rate, υ0, in the LHSV is frequently measured as that of a liquid feed rate at 60°F or 75°F, even though the feed to the reactor may be a vapor at some higher temperature. Strange but true. The gas volumetric flow rate, υ0, in the GHSV is normally reported at standard temperature and pressure (STP).
![]()
![]()
Example 2-6. Reactor Space Times and Space Velocities
Calculate the space time, τ, and space velocities for the reactor in Examples 2-1 and 2-3 for an entering volumetric flow rate of 2 dm3/s.
The entering volumetric flow is 2 dm3/s (0.002 m3/s).
From Example 2-1, the CSTR volume was 6.4 m3 and the corresponding space time, τ, and space velocity, SV are
![]()
It takes 0.89 hours to put 6.4 m3 into the reactor.
![]()
From Example 2-3, the PFR volume was 2.165 m3, and the corresponding space time and space velocity are
![]()
![]()
Analysis: This example gives an important industrial concept. These space times are the times for each of the reactors to take the volume of fluid equivalent to one reactor volume and put it into the reactor.
Summary
In these last examples we have seen that in the design of reactors that are to be operated at conditions (e.g., temperature and initial concentration) identical to those at which the reaction rate data were obtained, we can size (determine the reactor volume) both CSTRs and PFRs alone or in various combinations. In principle, it may be possible to scale up a laboratory-bench or pilot-plant reaction system solely from knowledge of –rA as a function of X or CA. However, for most reactor systems in industry, a scale-up process cannot be achieved in this manner because knowledge of –rA solely as a function of X is seldom, if ever, available under identical conditions. By combining the information in Chapters 3 and 4, we shall see how we can obtain –rA = f(X) from information obtained either in the laboratory or from the literature. This relationship will be developed in a two-step process. In Step 1, we will find the rate law that gives the rate as a function of concentration (Chapter 3) and in Step 2, we will find the concentrations as a function of conversion (Chapter 4). Combining Steps 1 and 2 in Chapters 3 and 4, we obtain –rA = f(X). We can then use the methods developed in this chapter, along with integral and numerical methods, to size reactors.
Coming Attractions in Chapters 3 and 4
• Mole Balance, Ch 1
• Rate Law, Ch 3
• Stoichiometry, Ch 4
• Combine, Ch 5
• Evaluate, Ch 5
• Energy Balance, Ch 11
Summary
- The conversion X is the moles of A reacted per mole of A fed.


For reactors in series with no side streams, the conversion at point i is

- In terms of the conversion, the differential and integral forms of the reactor design equations become:

- If the rate of disappearance of A is given as a function of conversion, the following graphical techniques can be used to size a CSTR and a plug-flow reactor.
A. Graphical Integration Using Levenspiel Plots

The PFR integral could also be evaluated by
B. Numerical Integration
See Appendix A.4 for quadrature formulas such as the five-point quadrature formula with ΔX = 0.8/4 of five equally spaced points, X1 = 0, X2 = 0.2, X3 = 0.4, X4 = 0.6, and X5 = 0.8.
- Space time, τ, and space velocity, SV, are given by


DVD-ROM Materials
• Learning Resources
- Summary Notes for Chapter 2
- Web Module
A. Hippopotamus Digestive System


- Interactive Computer Games
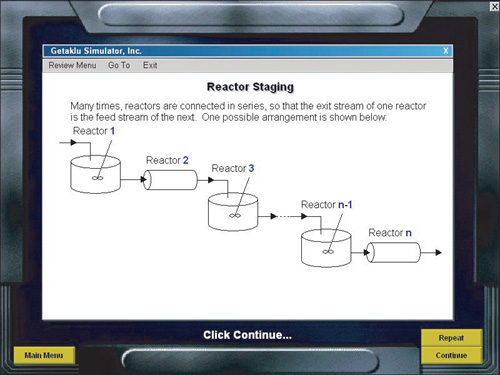
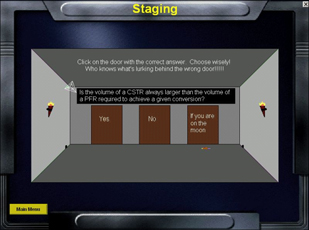
A. Reactor Staging


- Solved Problems
A. CDP2-AB More CSTR and PFR Calculations—No Memorization
• FAQ [Frequently Asked Questions]
• Professional Reference Shelf

Questions and Problems
The subscript to each of the problem numbers indicates the level of difficulty: A, least difficult; D, most difficult.
![]()
a. Without referring back, make a list of the most important items you learned in this chapter.
b. What do you believe was the overall purpose of the chapter?

a. Revisit Examples 2-1 through 2-3. How would your answers change if the flow rate, FA0, were cut in half? If it were doubled? What conversion can be achieved in a 4.5 m3 PFR and in a 4.5 m3 CSTR?
b. Revisit Example 2-4. How would your answers change if the two CSTRs (one 0.82 m3 and the other 3.2 m3) were placed in parallel with the flow, FA0, divided equally between the reactors.
c. Revisit Example 2-5. (1) What would be the reactor volumes if the two intermediate conversions were changed to 20% and 50%, respectively? (2) What would be the conversions, X1, X2, and X3, if all the reactors had the same volume of 100 dm3 and were placed in the same order? (3) What is the worst possible way to arrange the two CSTRs and one PFR?
Go to the Web site www.engr.ncsu.edu/learningstyles/ilsweb.html
a. Take the Inventory of Learning Style test, and record your learning style according to the Solomon/Felder inventory.
Global/Sequential_____
Active/Reflective_____
Visual/Verbal_____
Sensing/Intuitive_____
b. After checking pages 682 to 683 and on learning styles at the end of Chapter 2 Summary Notes on the DVD, suggest two ways to facilitate your learning style in each of the four categories.

ICG Staging. Load the Interactive Computer Game (ICG) from the DVD-ROM or Web. Play this game and then record your performance number, which indicates your mastery of the material. Your professor has the key to decode your performance number. Note: To play this game you must have Windows 2000 or a later version.
ICG Reactor Staging Performance # _________________________________
You have two CSTRs and two PFRs, each with a volume of 1.6 m3. Use Figure 2-2B to calculate the conversion for each of the reactors in the following arrangements.
a. Two CSTRs in series.
b. Two PFRs in series.
c. Two CSTRs in parallel with the feed, FA0, divided equally between the two reactors.
d. Two PFRs in parallel with the feed divided equally between the two reactors.
e. Caution: This is a C level problem. A CSTR and a PFR in parallel with the flow equally divided. Calculate the overall conversion, Xov

f. A PFR followed by a CSTR.
g. A CSTR followed by a PFR.
h. A PFR followed by two CSTRs. Is this arrangement a good arrangement or is there a better one?

The exothermic reaction
![]()
was carried out adiabatically and the following data recorded:

The entering molar flow rate of A was 300 mol/min.
a. What are the PFR and CSTR volumes necessary to achieve 40% conversion? (VPFR = 72 dm3, VCSTR = 24 dm3)
b. Over what range of conversions would the CSTR and PFR reactor volumes be identical?
c. What is the maximum conversion that can be achieved in a 105-dm3 CSTR?
d. What conversion can be achieved if a 72-dm3 PFR is followed in series by a 24-dm3 CSTR?
e. What conversion can be achieved if a 24-dm3 CSTR is followed in a series by a 72-dm3 PFR?
f. Plot the conversion and rate of reaction as a function of PFR reactor volume up to a volume of 100 dm3.
In bioreactors, the growth is autocatalytic in that the more cells you have, the greater the growth rate (Chapter 9)
![]()
The cell growth rate, rg, and the rate of nutrient consumption, rS, are directly proportional to the concentration of cells for a given set of conditions. A Levenspiel plot of (1/–rS,) as a function of nutrient conversion XS = (CS0 – CS)/CS0, is shown in Figure P2-7B.
Figure . Figure P2-7B Levenspiel plot for bacteria growth.

The nutrient feed rate is 1.0 kg/h with CS0 = 0.25 g/dm3.
a. Compare the chemostat (CSTR) volume necessary to achieve 40% substrate conversion with the volume necessary to achieve 80% conversion.
b. What conversion could you achieve with an 80-dm3 CSTR?
c. How could you arrange a CSTR and PFR in series to achieve 80% conversion with the minimum total volume? Repeat for two CSTRs in series.
d. Show that when the Monod Equation for cell growth
![]()
is combined with the stoichiometric relationship between the cell concentration, CC, and the substrate concentration, CS, i.e.,
CC = YC/S[CS0 – CS] + CC0 = 0.1[CS0 – CS] + 0.001
the shape of the resulting Levenspiel curve is consistent with the shape of the curve shown in Figure P2-7B. Note: The KM is Monod constant for cell growth, and YC/S is the stoichiometric coefficient, which will be discussed further in Chapter 9.
The adiabatic exothermic irreversible gas-phase reaction
![]()
is to be carried out in a flow reactor for an equimolar feed of A and B. A Levenspiel plot for this reaction is shown in Figure P2-8B.
Figure . Figure P2-8B Levenspiel plot.

a. What PFR volume is necessary to achieve 50% conversion?
b. What CSTR volume is necessary to achieve 50% conversion?
c. What is the volume of a second CSTR added in series to the first CSTR (Part b) necessary to achieve an overall conversion of 80%?
d. What PFR volume must be added to the first CSTR (Part b) to raise the conversion to 80%?
e. What conversion can be achieved in a 6 × 10⁴ m3 CSTR and also in a 6 × 10⁴ m3 PFR?
f. Think critically (cf. Table P-1, page xiv) to critique the answers (numbers) to this problem.
Estimate the reactor volumes of the two CSTRs and the PFR shown in the photo in Figure 2-9. [Hint: Use the dimensions of the door as a scale.]
The curve shown in Figure 2-1 is typical of a reaction carried out isothermally, and the curve shown in Figure P2-11B is typical of a gas-solid catalytic exothermic reaction carried out adiabatically.
Figure . Figure P2-11B Levenspiel plot for an adiabatic exothermic heterogeneous reaction.

a. Assuming that you have a fluidized CSTR and a PBR containing equal weights of catalyst, how should they be arranged for this adiabatic reaction? In each case, use the smallest amount of catalyst weight and still achieve 80% conversion.
b. What is the catalyst weight necessary to achieve 80% conversion in a fluidized CSTR?
c. What fluidized CSTR weight is necessary to achieve 40% conversion?
d. What PBR weight is necessary to achieve 80% conversion?
e. What PBR weight is necessary to achieve 40% conversion?
f. Plot the rate of reaction and conversion as a function of PBR catalyst weight, W.
Additional information: FA0 = 2 mol/s.

Read the “Chemical Reaction Engineering of Hippopotamus Stomach” on the DVD-ROM or on the Web.
a. Write five sentences summarizing what you learned from the module.
b. Work problems (1) and (2) on the hippo module.
c. The hippo has picked up a river fungus, and now the effective volume of the CSTR stomach compartment is only 0.2 m3. The hippo needs 30% conversion to survive? Will the hippo survive?
d. The hippo had to have surgery to remove a blockage. Unfortunately, the surgeon, Dr. No, accidentally reversed the CSTR and the PFR during the operation. Oops!! What will be the conversion with the new digestive arrangement? Can the hippo survive?
![]()
What is wrong with this solution? An adiabatic liquid phase exothermic reaction is to be carried out in a 25 dm3 CSTR. The entering molar flow rate of A times the reciprocal of the rate of reaction is shown below in Figure P2-13A(a) as a function of conversion.
What is the conversion exiting the CSTR?

Solution
We are given ![]() vs. X and that the volume is 25 dm3. We need to find the X such that area of the CSTR rectangle
vs. X and that the volume is 25 dm3. We need to find the X such that area of the CSTR rectangle ![]() . This is the trial and error procedure.
. This is the trial and error procedure.
Let’s calculate the area in the rectangle with the conversion at the minimum and see if it matches the volume of 25 dm3 given in the problem statement at the minimum.
For X = 0.5 the area of the shaded rectangle [Figure P2-13A(b)] is
![]()
It matches!! Therefore X = 0.5.
• Additional Homework Problems on the DVD-ROM
CDP2-AB
Use Levenspiel plots to calculate PFR and CSTR reactor volumes given –rA = f(X). (Includes Solution) [ECRE, 2nd Ed. P2-12B]
CDP2-BA
An ethical dilemma as to how to determine the reactor size in a competitor’s chemical plant. [ECRE, 2nd Ed. P2-18B]
Supplementary Reading
Further discussion of the proper staging of reactors in series for various rate laws, in which a plot of -1/rA versus X is given, is presented in
BURGESS, THORNTON W., The Adventures of Poor Mrs. Quack, New York: Dover Publications, Inc., 1917.
KARRASS, CHESTER L., Effective Negotiating: Workbook and Discussion Guide, Beverly Hill, CA: Karrass Ltd., 2004.
LEVENSPIEL, O., Chemical Reaction Engineering, 3rd ed. New York: Wiley, 1999, Chapter 6, pp. 139–156.