
John Stasko
Georgia Institute of Technology
45.2Value of Data Structure Rendering
45.3Issues in Data Structure Visualization Systems
Purpose and Environment•Data Structure Views•Interacting with a System
45.4Existing Research and Systems
Incense•VIPS•GELO•DDD•Other Systems
Important advances in programming languages have occurred since the early days of assembly languages and op codes, and modern programming languages have significantly simplified the task of writing computer programs. Unfortunately, tools for understanding programs have not achieved the accompanying levels of improvement. Software developers still face difficulties in understanding, analyzing, debugging, and improving code.
As an example of the difficulties still evident, consider a developer who has just implemented a new algorithm and is now ready to examine the program’s behavior. After issuing a command to begin program execution, the developer examines output data and/or interactive behavior, attempting to ascertain if the program functioned correctly, and if not, the reasons for the program’s failure. This task can be laborious and usually requires the use of a debugger or perhaps even the addition of explicit checking code, usually through output statements. Furthermore, the process can be quite challenging and the average developer may not be that skilled in fault diagnosis and correction. It would be extremely advantageous to have a tool that allows programmers to “look inside” programs as they execute, examining the changes to data and data structures that occur over time. Such a tool also could provide helpful context by identifying the current execution line, the active program unit, and the set of activations that have occurred to reach this configuration.
Tools, such as the one described above, are one form of software visualization [1]. Price, Baecker, and Small describe software visualization as, “the use of the crafts of typography, graphic design, animation, and cinematography with modern human-computer interaction and computer graphics technology to facilitate both the human understanding and effective use of computer software [2].” Fundamentally, software visualization seeks to take advantage of the visual perception and pattern matching skills of people to assist software development and software understanding. Human beings have very sophisticated visual perception systems that we constantly use to help us think [3]. Software visualization is a subfield in the larger area of information visualization [4,5] that studies how visualizations serve as external cognition aids.
Software visualization research and systems fall into two primary categories, program visualization and algorithm visualization.
Program visualization systems present data about and attributes of some existing software system. Typically, program visualizations are used in a software engineering context, that is, to help design, implement, optimize, test, or debug software. Thus, program visualization systems often illustrate source code, program data, execution statistics, program analysis information, or program objects such as data structures. The imagery in program visualization systems also is usually displayed with little or no input from the user/viewer. That is, a program (source code or executable) is analyzed by the system, which then automatically produces the graphics when the user requests them.
Algorithm visualization, conversely, strives to capture the abstractions and semantics of an algorithm or program primarily for pedagogical purposes. One often thinks of algorithm visualization as being more “high-level” as compared to program visualization being more “low level.” The term algorithm animation is used interchangeably for this area simply because the displays are so dynamic and algorithm operations appear to animate over time. More specifically, Brown states, “Algorithm animation displays are, essentially, dynamic displays showing a program’s fundamental operations—not merely its data or code [6].” Algorithm visualizations typically are hand-crafted, user-conceptualized views of what is “important” about a program. These types of views usually require some person, often the system developer or the program’s creator, design and implement the graphics that accompany the program. The highly abstract, artificial nature of algorithm animations makes their automatic generation exceptionally difficult.
This chapter focuses on one specific subarea of software visualization, the visualization of data structures. By displaying pictures of data structures, one seeks to help people better understand the characteristics and the use of those structures.
How the data in computer programs are manipulated and organized by groups is a key aspect of successful programming. Understanding how elements of the data relate to other elements is a vital component in being able to comprehend and create sophisticated algorithms and programs. The word “structure” in “data structure” simply reinforces this point.
A person learning a new piece of software and seeking to modify it for some added functionality will likely ask a number of different questions. How are data elements organized? Is some kind of sequential structure used or is a more complicated organization present? Which items reference which other items? Understanding the answers to questions such as these helps a person to understand the utility and value of data structures. Providing pictures to express the relationships of data elements clearly then is one of the most useful ways to answer those questions.
45.2Value of Data Structure Rendering
The graphical display of data structures can benefit a number of different activities, and one key role is as an aid for computer science education. It is not uncommon for students to have difficulty learning to understand and use non-trivial data structures such as arrays, lists, stacks, queues (Chapter 2), and trees (Chapter 3). One common problem occurs in the mapping back-and-forth between the pseudo code or programming language implementation of a structure and its conceptual model. In current educational methods, to foster understanding, the conceptual model (abstraction) is often presented in some graphical representation or picture—an interesting challenge is to find a book about data structures that does not make liberal use of pictures.
Systems for visualizing data structures typically provide or operate in an environment containing both the structures’ programming language implementation and their graphical display, which facilitates students making connections between the two. This allows an instructor to prepare a collection of “interesting” data structures for students to interact with and learn from. By examining the accompanying displays, students can make the connection from a structure’s abstract properties to its concrete implementation.
Another activity in which data structure visualization systems can provide significant help is program debugging. When a data structure display tool is used in conjunction with a traditional textual debugger, it allows the active data structures to be displayed and examined in some graphical format as program execution occurs and units of code are examined. When the program’s data change, the accompanying visualizations change too, reflecting the new program state.
The graphical display of data structures adds many advantages to strict textual debugging. Because a human’s visual perception system is a highly-tuned information processing machine, the sheer amount of information that can be transmitted to the user is much greater using graphics. With a textual debugger, people usually need to issue queries variable-by-variable to discover values. One glance at a computer display showing simultaneous representations of multiple structures may convey as much information as several minutes of the “query-reply” loop in a conventional debugger.
In addition to discovering data values, programmers use debuggers to access the relationships and connections between different pieces of data. This is a particular area in which graphical display is much more beneficial than textual interpreters. For example, to check the structure of a linked list in a language such as C++ or Java, a programmer must print out a list item’s values and references to other list items. By carefully examining the resulting values, the programmer can determine if the list is in the desired configuration. A data structure visualization tool that could display a linked list as a series of rectangular nodes with arrows acting as the references or pointers connecting the different nodes would tremendously simplify the programmer’s task of determining relationships among the data.
Data structure visualization tools also can aid the acquisition of contextual information about the state of a debugging session. For instance, a display could show a simple persistent view of the call stack and current execution line number in addition to the data pictures. In most debuggers, a user must often make repeated explicit queries to determine this information.
For these reasons and many more, data structure visualization systems remain a relatively untapped source of value to programmers. It is quite surprising that, given these benefits, more attention and research have not been devoted to the area, and data structure visualization systems have yet to achieve widespread use and adoption.
45.3Issues in Data Structure Visualization Systems
The software environment in which a data structure visualization system resides will influence many of the system’s capabilities. Data structure display systems usually target a specific programming language or set of languages for visualization. In particular, many systems display only strongly-typed languages, simply because one is able to infer more information concerning the structure and composition of data objects in a strongly typed language. It also is easier to “customize” a specific graphical look for the different data structure types in a strongly typed language. A weakly typed language such as an assembly language generally forces a more generic looking display of data.
Clearly, the inherent characteristics of a particular programming language will also influence the language’s resulting data visualizations. We would expect the node-pointer list data depiction to be an integral part of a LISP visualization system, while imperative languages such as C or Pascal would necessitate repeated use of a flexible structured, tiled image with easy to recognize and identify sub-fields. The display of graphical objects representing class instances and some form of arcs or arrows for messages (method invocations) would be important for illustrating an object-oriented language such as C++ or Java.
The intended audience of a data structure visualization system also affects the system’s resulting displays. For example, a system designed for use by introductory programmers would probably stress consistent, simplified data structure views. Conversely, a system targeted to advanced programmers should support sophisticated, customized displays of complex, large data objects. Such a system should also allow a viewer to quickly suppress unwanted display objects and focus on items of special interest.
One common use of data structure visualization systems is in conjunction with other tools in a programming environment or an integrated development environment (IDE). For example, “attaching” a data structure visualization system to a program execution monitor allows the display of graphical data snap-shots at various points in the program’s execution. By consistently displaying imagery, a form of program data animation results, showing how a program’s data change over time.
Most often, a data structure visualization system functions in conjunction with a program debugger. In this arrangement, the display system provides a graphical window onto the program, permitting a persistent view of the data as opposed to the query-based approach of a textual debugger. While a programmer navigates through her program and its data by using a debugger, a data structure visualization system can map the particular data objects of interest onto a graphical format. As discussed in the previous section, the graphical format provides many benefits to typical debugging activities.
A primary distinguishing characteristic of a data structure visualization system is the types of data views it supports. Most systems provide a set of default views for the common data types such as integers, floats, and strings. Some systems also provide default views for more complex composite structures such as arrays, lists, and trees. Visualization systems frequently differ in their ability to handle a display request for a data object of a type other than those in the default view set. Reactions to such a query may range from taking no display action to utilizing a generic view applicable to all possible data types. Some systems also provide users with the ability to tailor a special graphical view for a particular, possibly uncommon data type. The process of defining these views is often tedious, however, discouraging such forms of improvisation.
Specific, relatively common data views that are often handled in varying ways include pointers/references, fields within composite structures, and arrays. Pointers/references, usually represented in a line-arrow manner, present a particularly tricky display problem because they involve issues similar issues to those evident in graph layout, a known difficult problem [7] (see also Chapter 47). Ideally, a view with pointers should minimize pointer overlap, edge crossings, and collisions with other display objects. Both polyline and spline display formats for pointers are common.
Representing fields within a composite data structure is a difficult problem because of spacing and layout concerns. Subfields can be complex structures themselves, complicating efforts to make the data structure view clear and comprehensible.
Arrays present a challenging visualization problem because of the variety of displays that are possible. For instance, a simple one-dimensional array can be presented in a horizontal or vertical format. The ideal view for multi-dimensional arrays can also be a difficult rendering task, particularly for arrays of dimension three or higher.
The ability to display multiple views of a specific data instance is also a valuable capability of a data structure visualization system because certain display contexts may be more informative in particular situations. Allowing varying levels of view abstraction on data is another important feature. For example, consider an array of structures in the C programming language. At one level, we may wish to view the array formation globally, with each structure represented by a small rectangle. At a closer level, we may wish to view a particular array structure element in full detail, with little attention paid to the other array elements.
Some data structure display systems provide visualizations for components of program execution such as program flow of control and the call stack. While these components are not program data structures, their graphical visualizations can be helpful additions to a data structure display system, especially when used in conjunction with a debugger.
45.3.3Interacting with a System
Data structure visualization systems provide many different ways for users to interact with the system. For instance, consider the manner that users employ to actually display a particular piece of data. Systems that work in conjunction with a debugger may provide a special display command in the debugger. Other systems may utilize a specialized user interface with a particular direct manipulation protocol for invoking data display, such as choosing a menu item and supplying a variable name or graphically selecting a variable in a source code view.
Visualization systems vary in the manner of interactions they provide to users as well. For instance, once data is selected for display, the corresponding image(s) must be rendered on the viewing area. One option for this rendering is to allow the viewer to position the images, usually with the mouse. This method has the advantage of giving the user explicit control, but often, such repeated positioning can become tedious. Another rendering option gives the system total placement control. This method has the advantage of requiring less viewer input, but it requires sophisticated layout algorithms to avoid poor layout decisions. Perhaps the most attractive rendering option is a combination of these two: automatic system display with subsequent user repositioning capabilities.
Limits in display window viewing area force data structure visualization systems to confront sizing issues also. One simple solution to the problem of limited viewing space is to provide an infinite, scrollable viewing plane. Another solution, one more closely integrated with the system, is to utilize varying display abstractions dependent upon the amount of space available to view a data object. For example, given no space limitations, an object could be rendered in its default view. With very limited space, the object could be rendered in a space-saving format such as a small rectangle.
Once data has been displayed in the viewing window, the viewer should be able to interact with and control the imagery. Allowing a user to interactively move and delete images is certainly desirable. Even more beneficial, however, is the capability to suppress aspects of the data that are not of interest. For instance, only a small section of an array may be “interesting,” so a visualization system could deemphasize other portions as a user dictates. Similarly, only certain sections of linked lists and trees may require attention, and only certain fields with a particular structure type may be of interest. Allowing a viewer to quickly dispose of uninteresting attributes and focus on the matter at hand is a very valuable feature.
If a data structure visualization system works in conjunction with a debugger, display interaction may take on a further role, that of interactive debugging itself. Graphical editing of data imagery by the viewer can be interpreted as corresponding changes to the underlying data. For example, a system may allow a viewer to enter a new data value for a variable by graphically selecting its accompanying image and overwriting the value displayed there. An even more sophisticated action is to allow a viewer to “grab” a pointer variable, usually represented by an arrow on the display, and alter its value by dragging and repositioning the arrow image in order to make the pointer reference some other object.
45.4Existing Research and Systems
The idea of creating a system that would visualize data structures in computer programs is an old one, dating back even to the 1960’s [8]. During this long history, a number of systems for data structure visualization have been developed. Most, however, have only been research prototypes and have never been used by anyone outside the system’s creator(s). This relative lack of adoption is surprising in light of the potential benefits of data structure display identified above. A quick survey of widely-used current IDEs notes that none provide anything beyond the most limited abilities to persistently display data values, or more importantly, visualize data structures.
For a good overview of the aesthetic considerations and the general challenges in drawing data structures, see the article by Ding and Mateti [9]. The authors provide a rigorous survey of the different styles of drawings used in data structure diagrams. They enumerate a set of characteristics that influence people’s perceptions of data structure illustrations, including visual complexity, regularity, symmetry, consistency, modularity, size, separation, shape, and traditional ways of drawing. Further, they develop a set of guidelines for drawing aesthetically appealing diagrams. The guidelines are based on rules, factors, and objectives, and include the ability to quantitatively assess the aesthetics of different diagrams. Ding and Mateti note that the automatic drawing of data structure representations is difficult because a diagram should be determined not only by a structure’s declaration, but also by its intended usage.
Stasko and Patterson echo that thought by identifying the notion of intention content in program visualizations [10]. They note that a programmer’s intent in creating and using a data structure can significantly influence how the structure should best be visualized. For instance, a simple array of integers may be shown as a row of rectangles with the values inside; a row of rectangles whose height is scaled to the value of each element; a round pie chart with a wedge whose percentage size of the circle corresponds to the value of that array element; or a stack with the array elements sitting on top of each other. To generate the latter two representations, some knowledge of the purpose and goal of the surrounding program code is necessary.
In the remainder of this section, we present brief summaries of a few of the most noteworthy data structure visualization systems that have been developed. Each of these grew from research projects, and the final one, DDD, has been used significantly by outside users. In reviewing each system, we highlight its unique aspects, and we evaluate it with respect to the issues raised in the previous section.
The Incense system [11] developed by Myers was one of the earliest attempts to build a relatively full-featured data structure display system. Myers stated that Incense allowed a “programmer to interactively investigate data structures in actual programs.”
The system operated on a Xerox Alto personal computer and displayed data structures for the Mesa strongly typed programming language. In the system, data structures could be displayed at debug time by supplying a variable’s name; Incense examined the symbol table to determine the variable’s type. Once a variable was chosen, the user specified via the mouse a rectangular viewing area inside the active window to display the data. Incense automatically chose the appropriate view abstraction given the space requirements. Data with insufficient screen space were displayed as grey boxes.
The system included a large number of sophisticated default views for the language’s data types and structures, and it utilized a spline-based method for displaying pointers. Examples of views of different types of data structures are shown in Figure 45.1. Additionally, users could define their own data views using a predefined graphics library in Mesa. The difficulty of that process is unclear.
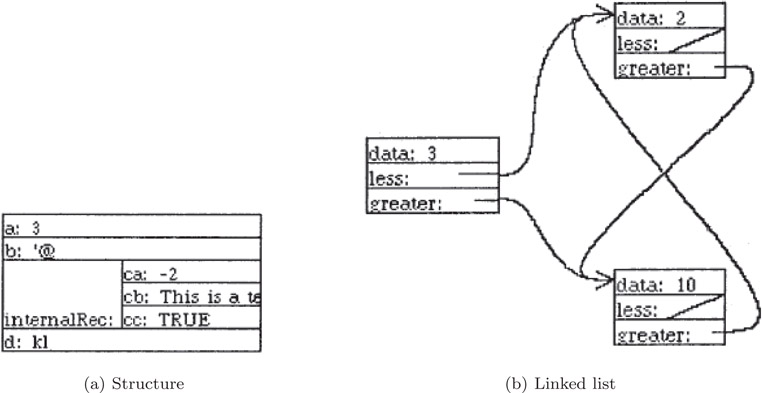
Figure 45.1Example data structure views shown in the Incense system. Pictures provided by and reprinted with permission of Brad Myers.
In order to implement Incense, Myers created the concept of an artist, a collection of procedures and data that handled display, erasure, and modification of the data being displayed. An artist had to be associated with a piece of data in the system in order to display it. To display pointers as arrows, Incense utilized layouts, special types of artists designed to locate and manage the various pointer and referent components of data.
The system was designed to allow users to also edit variables’ values at run-time in the graphical presentation, but it does not appear that this feature was ever implemented. Unfortunately, the host hardware’s space and processing limitations made Incense’s performance relatively poor which likely restricted it to being a research prototype. The system did, however, illustrate a multitude of valuable capabilities that a data structure visualization system could offer.
The VIPS [12] visual debugger by Shimomura and Isoda focused on providing a flexible set of views of lists in programs. The system ran on top of the DBX debugger, with VIPS and DBX communicating through pipes. For instance, when a user would issue a request to display a list, the VIPS system would send necessary messages to DBX to extract information needed for the display. In addition to views of list data structures, VIPS provided views (windows) of program text, I/O, variable displays, as well as control windows for debugger interactions.
VIPS provided two main views of program lists, the whole list view and the partial list view. In the whole view, shown on the left side of Figure 45.2, list nodes were represented as small black rectangles thus allowing more than 100 nodes to be shown at once. The basic layout style used by the system was a classic binary tree node-link layout with the root at the left and the tree growing horizontally to the right. The whole list view assisted users in understanding structure. The partial list view, shown on the right-hand side of Figure 45.2, presented each node in a more magnified manner, allowing the user to see the values of individual fields within the node. By dragging a rectangle around a set of nodes in the whole list view, a user could issue a command to generate a new partial list view. VIPS also allowed users to select particular pointer fields in list structures and only have the nodes connected by those pointers to be displayed.
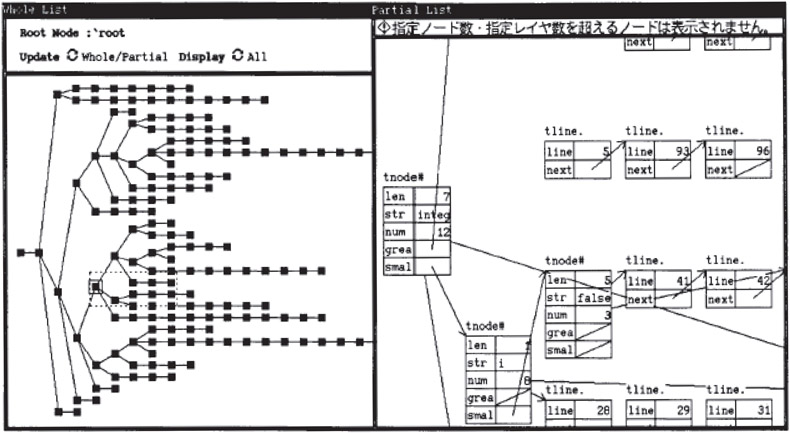
Figure 45.2Data structure views in the VIPS system. (Picture reprinted with permission from T. Shimomura and S. Isoda. IEEE Software, 8, 3, 1991, 44–51 page 47, copyright 1991 IEEE.)
To assist debugging, VIPS also provided a highlight feature in which list structures with values that had recently changed were highlighted in order to draw the viewer’s attention.
An earlier version of the system [13] provided multiple run-time views of executing Ada programs. Default data views in the system included scalars, linked lists, one-dimensional arrays and records. VIPS also allowed users to design their own data displays or “figures” by writing programs in the Figure Description Language FDL, a subset of Ada. FDL programs contained parameters that could be associated with a variable or variables, promoting view control via data values. Data displays were rendered automatically by the system. When space was tight, smaller representations were utilized.
The VIPS debugger provided one of the most extensive graphically-aided debugging systems onto a particular language. By adding views of the call stack, data flow, and program structure to program data visualizations, the system explored the boundary of visual debugging efforts at that time.
The GELO system [14] was designed to ease the production and display of complex pictures of programs and data structures. In the system, strongly typed data structures were displayed as picture objects of types data, tile, layout, arc, and empty. GELO differed from many other data structure display systems in that diagrams were not described in a world coordinate space, but by giving a set of topological constraints for their views.
The system was organized as three components: GELO managed the specification and display of classical program and data structures; APPLE allowed a user to design and customize the way that a particular data structure would appear by providing mechanisms for defining the mapping between the data structure and the GELO structures (more than one mapping was allowed); PEAR used these mappings to allow the user to edit the structures’ display, thereby modifying the underlying data structures.
GELO allowed users to specify both the data instances to be displayed and the drawing attributes of the display through fairly complex dialog box selections. It provided default displays for common structures such as lists and trees, as well as various heuristics for graph layout. A sample list view is shown in Figure 45.3 and a tree view is shown in Figure 45.4. GELO included view panning and zooming, abstractions on small objects, and scrollable windows.
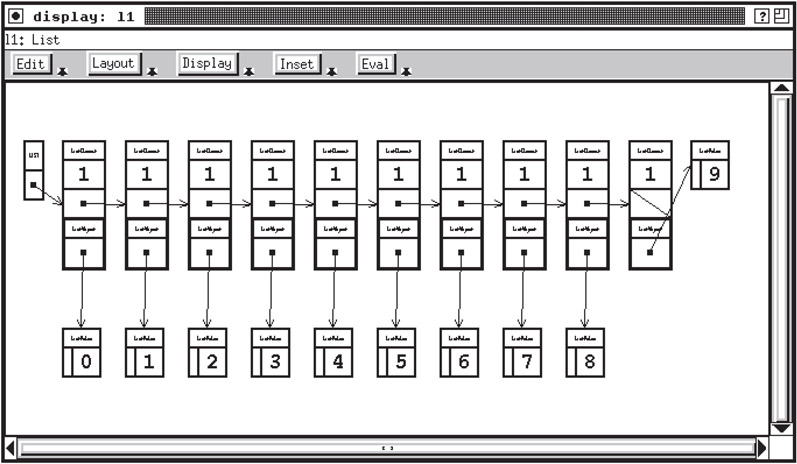
Figure 45.3GELO view of a list. Picture provided courtesy of Steve Reiss.
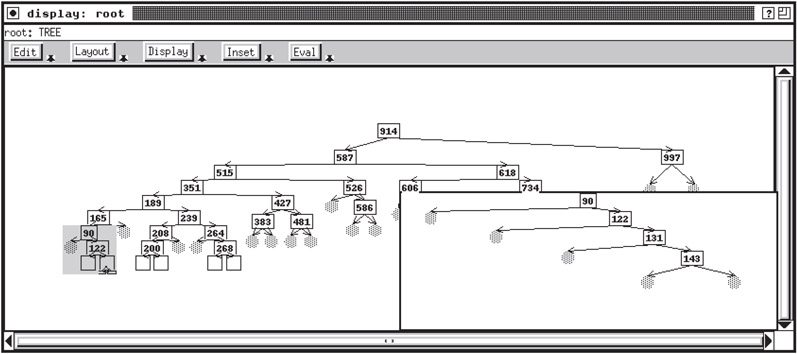
Figure 45.4GELO view of a tree. Picture provided courtesy of Steve Reiss.
Reiss noted that the system’s topological layout scheme was sometimes overly restrictive; users may have wanted to have a picture “look just so” but GELO did not provide this capability. The sheer amount of dialog and menu choices for designing a display also appeared to be daunting, but the sophistication of automatic layout GELO provided was quite impressive.
The DDD System [15,16], developed by Zeller, provides some of the most sophisticated graphical layout capabilities ever found in a data structure display system. DDD is technically a front-end to command-line debuggers such as GDB and DBX, and it provides all the capabilities of those debuggers. Additionally, program variables can be visualized in displays, rectangular windows that can be placed on a user’s canvas.
DDD’s sophistication comes in its techniques for visualizing pointer dereferencing. It draws a directed edge from one display to another to indicate the reference. DDD contains simple placement rules with edges pointing right and downward, or if desired, sophisticated graph layout algorithms can be invoked. Figure 45.5 shows an example data structure view from DDD.
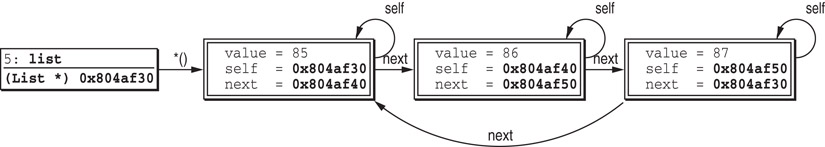
Figure 45.5An example DDD representation of a linked list structure. Picture provided courtesy of Andreas Zeller.
In the default display mode, only one edge can point to any display. Thus, it is possible to have a visualization in which a display (variable or specific piece of memory) appears multiple times. DDD also provides alias detection, however, so that all program data residing at the same location are consolidated to the same display object. Thus, lists with cycles will be shown as the circular representation that one would expect.
DDD is particularly noteworthy in that the system is available as free software and it has been widely downloaded and utilized. It is perhaps the data structure visualization that has been most used by people other than the system creators.
In addition to the systems mentioned above, a number of other data structure display tools have been developed over the years. Some of the more noteworthy ones include
•GDBX [17]—A graphical extension to the UNIX debugger DBX.
•PROVIDE [18]—An ambitious process visualization and debugging environment for programs written in a subset/variant of the C programming language.
•Amethyst [19]—A system intended to simplify data structure visualization for novice programmers.
•DS-Viewer [20]—A system that focused on the display of structures in a weakly typed language such as an assembler language.
•Lens [21]—A layer on top of the DBX debugger that provided, via programmer annotations, both data structure display capabilities as well as simple algorithm animation operations.
•SWAN [22]—A system that allowed instructors and students to easily annotate programs to produce data structure views.
Although the systems summarized in this paper have shown the promise that data structure visualization holds, data structure display systems still are not widely used in teaching and still are not commonly included in IDEs for programmers to use. Until data structure display systems achieve more general acceptance, the area will continue to exhibit unfulfilled potential. Anyone who has ever programmed will surely agree that a visualization of the complex interactions of data can only help comprehension and debugging of computer programs. Now that software and hardware improvements for graphical displays have made these types of visualizations routine, hopefully, this unfulfilled potential will be reached. Below we describe some specific problems that remain to be solved in order to help foster the growth of data structure visualization.
•User-defined displays – Invariably, advanced programmers or programmers in a specific application area will want to build customized views of particular data types and structures. Existing systems have only either provided generic default displays or have required people to do tedious graphical design in order to build custom views. A powerful data structure display system should allow users to quickly and easily demonstrate a new graphical form for a data structure. Thus, a data structure display system likely must include some form of sophisticated graphical editor or toolkit to facilitate view design.
•Mapping data to their display – In addition to designing new views, designers must be able to specify how data is to be interpreted to generate the views. Creating an easy-to-understand and easy-to-use mapping scheme is quite difficult, particularly if multiple pieces of data can “drive” a particular view or one piece of data can be presented in different view abstractions.
•Complex, large data – With the possible exception of DDD, prior data structure display systems have been better suited for programming-in-the-small with relatively straightforward, moderate-sized data structures. Sophisticated display imagery becomes significantly more difficult as the complexity and sheer size of the data increases, thereby complicating screen layout issues. Further abstraction and mapping strategies are required to properly address these issues also.
1.J. Stasko, J. Domingue, M. Brown, and B. Price, editors. Software Visualization: Programming as a Multimedia Experience. MIT Press, Cambridge, MA, 1998, 562 pages.
2.B. Price, R. Baecker, and I. Small. An introduction to software visualization. In J. Stasko, J. Domingue, M. Brown, and B. Price, editors, Software Visualization: Programming as a Multimedia Experience, MIT Press, Cambridge, MA, 1998, pp. 3–27.
3.C. Ware. Information Visualization: Perception for Design. Morgan Kaufman, San Francisco, 2000, 438 pages.
4.S. Card, J. Mackinlay, and B. Shneiderman, editors. Readings in Information Visualization: Using Vision to Think. Morgan Kaufmann, San Francisco, 1999, 686 pages.
5.R. Spence. Information Visualization. ACM Press, Pearson Education, Essex, England, 2001, 206 pages.
6.M. Brown. Perspectives on algorithm animation. ACM CHI, Washington, DC, 1988, pp. 33–38.
7.G. Di Battista, P. Eades, R. Tamassia, and I. Tollis. Graph Drawing: Algorithms for the Visualization of Graphs. Prentice Hall, Upper Saddle River, NJ, 1998, 397 pages.
8.R. Baecker. Experiments in on-line graphical debugging: The interrogation of complex data structures. Hawaii International Conference on the System Sciences, Honolulu, HI, 1968, pp. 128–129.
9.C. Ding and P. Mateti. A framework for the automated drawing of data structure diagrams. IEEE Transactions on Software Engineering, 16, 5, 1990, 543–557.
10.J. Stasko and C. Patterson. Understanding and characterizing software visualization systems. IEEE Workshop on Visual Languages, Seattle, WA, 1992, pp. 3–10.
11.B. Myers. A system for displaying data structures. SIGGRAPH, Detroit, MI, 1983, pp. 115–125.
12.T. Shimomura and S. Isoda. Linked-list visualization for debugging. IEEE Software, 8, 3, 1991, 44–51.
13.S. Isoda, T. Shimomura, and Y. Ono. VIPS: A visual debugger. IEEE Software, 4, 3, 1987, 8–19.
14.S. Reiss, S. Meyers, and C. Duby. Using GELO to visualize software systems. ACM UIST, Williamsburg, VA, 1989, pp. 149–157.
15.A. Zeller. Visual debugging with DDD. Dr. Dobb’s Journal, 322, 2001, 21–28.
16.T. Zimmermann and A. Zeller. Visualizing memory graphs. In S. Diehl, editor, Software Visualization State-of-the-Art Survey, LNCS 2269, Springer-Verlag, Berlin, Germany, 2002, pp. 191–204.
17.D. Baskerville. Graphic presentation of data structures in the DBX debugger. Technical Report UCB/CSD 86/260, University of California at Berkeley, 1985.
18.T. Moher. PROVIDE: A process visualization and debugging environment. IEEE Transactions on Software Engineering, 14, 6, 1988, 849–857.
19.B. Myers, R. Chandhok, and A. Sareen. Automatic data visualization for novice Pascal programmers. IEEE Workshop on Visual Languages, Pittsburgh, PA, 1988, pp. 192–198.
20.D. Pazel. DS-Viewer: An interactive graphical data structure presentation facility. IBM Systems Journal, 28, 2, 1989, 307–323.
21.S. Mukherjea and J. Stasko. Toward visual debugging: Integrating algorithm animation capabilities within a source level debugger. ACM Transactions on Computer-Human Interaction, 1, 3, 1994, 215–244.
22.C. Shaffer, L. Heath, J. Nielsen, and J. Yang. SWAN: A student-controllable data structure visualization system. ED-MEDIA, Boston, MA, 1996, pp. 632–637.
* This chapter has been reprinted from first edition of this Handbook, without any content updates.