Before we start creating our own electronics to take readings from these sensors, we need to start with a little theory and testing to get a good understanding of how these sensors work and how we will be able to interact with them.
To start with, let's take a look at the mechanics and electronics used in the devices to know how the official device would have taken measurements from them (note that you do not have to disassemble your sensors here).
We will start with probably the simplest of all three—the rain gauge. If we unclip the top section, we will be able to notice a seesaw-like mechanism that carries water from the spout of the funnel in the top covered section to either the left-hand side or right-hand side of the sensor, depending on the position of the seesaw.
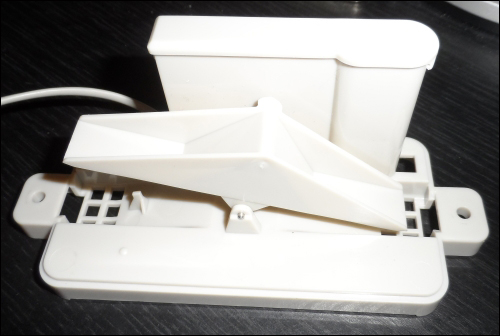
With each movement, the seesaw triggers a reed switch, a small switch that is activated using a magnet in the center of the seesaw that completes a circuit, which can be monitored by the measurement device.
While this method is quite effective at measuring when there is rainfall, it cannot accurately determine how much rainfall there has been, as this will partially depend on the rate of rainfall. Since this relationship is not linear, it would take more effort than what it is worth to derive. Simply representing the number of times the switch is triggered over a given sample time will be sufficient for our weather station.
Let's move on to the anemometer now. This is the device that will be used to determine how fast the wind is blowing. If you remove the three screws at the bottom of the sensor, we can notice that it has a similar reed switch. By attaching a multimeter in resistance mode, we can tell that the switch pulses closed circuit and then open circuit twice per revolution of the sensor.
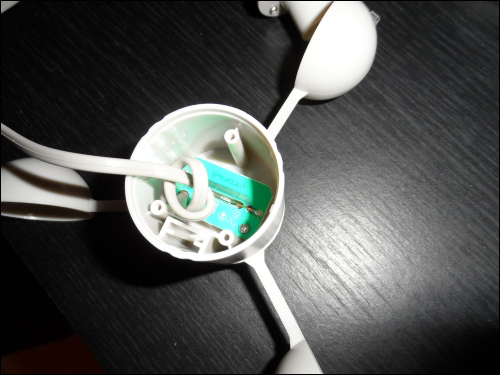
Given that we are able to measure time relatively accurately (up to millisecond precision) using Arduino, we can use the signal from this reed switch to measure the revolutions per minute (RPM) travelled by the anemometer. Then, we can multiply this by the circumference of the anemometer measured from the center of the cups to find the distance travelled by a single cup in one minute. Finally, convert this result to a standard unit (in our weather station this will be in miles per hour (MPH)) to get the wind speed.
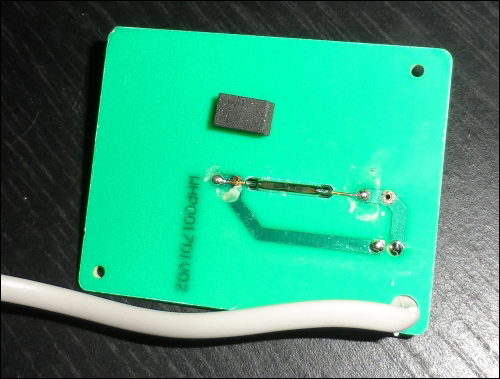
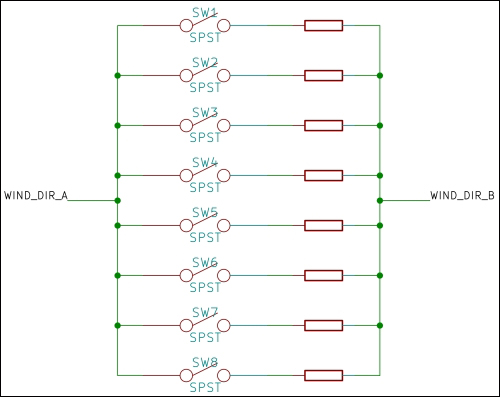
The final (and most interesting) sensor is the wind direction sensor. This is essentially a vane that points in a given direction if force is exerted on the side of the vane by the wind. If we open the bottom of this sensor, we can see a printed circuit board (PCB) that contains eight reed switches and a socket, which is used to connect the anemometer.
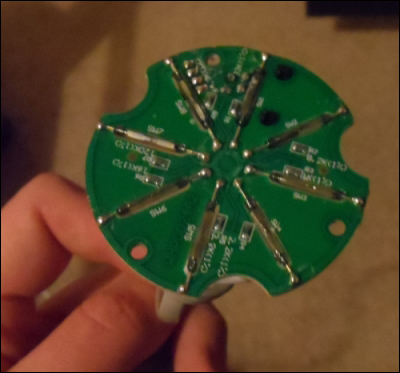
If you remove this PCB, you can see that the two middle connections of the socket are connected directly to the middle two connections of the cable running from the wind direction sensor, leaving just the outer two wires of the cable for the direction sensor.
On the reverse side of the PCB, you will also notice eight resistors marked with a given unique resistance on the PCB. Here, every reed switch has its own resistance (as shown in the following circuit diagram), and because of the spacing of the switches, only one can be activated at once. Therefore, by measuring the resistance across the circuit, you can set the position of the direction sensor accurate to 45 degrees.
Now that we know exactly how each of the sensors work, we can start interfacing them with our own electronics. Since this involves the need for accurate timing to measure the wind speed, we cannot use the Raspberry Pi to directly take readings from the sensors, as the Pi runs a scheduled operating system. This means that a given task can be stopped and restarted at random times without notice, which causes problems when you have code that must keep an accurate track of time.
Arduino, however, is a real-time system. This means that the code you write will never be stopped or paused (with the exception of interrupts). This allows you to ensure that certain parts of it will be executed in a given amount of time. Arduino also supports hardware interrupts on its GPIOs, which allow a function to be called whenever the state of a given pin changes. This will be used with both the rain sensor and anemometer to keep a precise track of the readings taken from these sensors.
Although it is not originally sold as a weather sensor, we will also be including a light-dependent resistor (LDR), which will be used to measure ambient light levels. As the name suggests, this is essentially a resistor that has a resistance that varies depending on the intensity of the light hitting its surface.
Since this is an analogue output (as with the wind direction sensor), we cannot use the Pi to take readings from it, as the GPIO pins on the Pi are only digital, whereas Arduino has several analogue inputs that can be used with sensors such as this.
Now is a good time to go over some of the theory of how the inputs to microcontrollers such as Arduino work. With both of our digital inputs here, we will essentially connect a switch between the input pin and ground pin. The chip used on Arduino has a pull-up resistor on each pin, which can be toggled in the software. This can be used to essentially make the reading from the pin read high unless there is a path to the ground with a lower resistance than the pull-up resistor, which in our case will be the reed switches that have negligible resistance.
With the analogue inputs, we will use an additional resistor to create what is called a potential divider. This is a circuit that, as the name suggests, outputs a voltage that is somewhere in between two input voltages, in our case, 5 V and ground (0 V). The potential divider makes it possible for a microcontroller to measure resistance by first converting it to voltage.
Now that we have an idea of how our sensors work, we can start to create the circuit that will allow us to interface with the sensors. Since a lot of the sensors are quite simple, this is a relatively easy task.
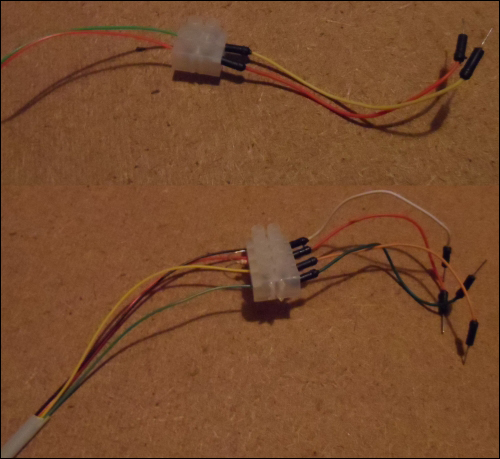
Firstly, we need to prepare the Maplin weather sensors to be connected to Arduino. While this can be done by purchasing the correct type of socket for the connectors they come fitted with, it will be easier in this case to simply cut them off and connect them using strips of terminal blocks. To do so, perform the following steps:
- Cut the two connectors off the ends of the long cables that are connected to the rain gauge and wind direction sensor. Do not remove the connection from the anemometer as this connects it to the socket on the wind direction sensor.
- Remove around 1-2 inches of the grey insulation to expose the colored wires.
- Strip around 10 mm of insulation from each of the colored wires.
- Connect the two wires from the rain gauge to one side of a strip of two terminal blocks.
- Connect the four wires from the wind direction sensor to one side of a strip of four terminal blocks in the order black, red, yellow, and green. This should be the same order for the wires arranged inside the cable.
- Insert a 1 kΩ resistor (color-coded as brown, black, and red) between the black and red wires coming from the wind direction sensor on the same side as them on the terminal block.
- On the other side of each of the terminal blocks, attach a male-to-male pin jumper wire. Note that the color does not have to match with that of the wire from the sensors. Whenever we refer to these wires, we will refer to them by the color of the wire from the sensor.
By now, the wiring from the sensors should look something like what is shown in the following image:
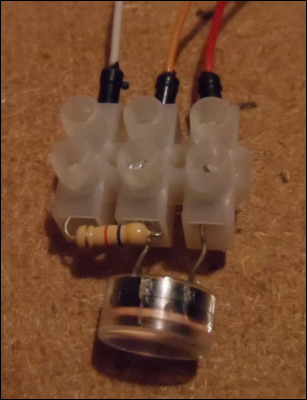
Next, we will prepare the LDR:
- Take a strip of three terminal blocks and connect the LDR to the center and the leftmost terminal.
- On the same side, connect a 4.7 kΩ resistor to the rightmost terminal and the center terminal.
- On the other side of the terminal block, connect a male-to-male pin jumper wire to each terminal.
Now, the terminal block with the LDR should look similar to the following image:
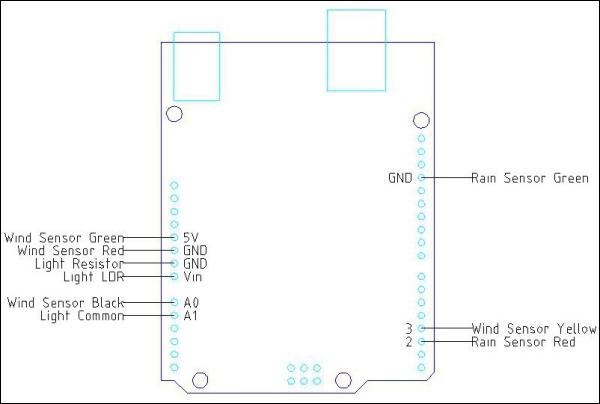
Now that we have the circuits required for our sensors built, we can connect them to the Arduino, as shown in the following diagram. This same wiring diagram will work for the majority of Arduino boards, including the Uno, Mega, Leonardo, and Duemilanove:
The final step to be taken for the sensors to work is uploading the software that will monitor the sensors and report information back to the Pi via your Arduino. To do this, we need to first download and install version 1.0.6 of the Arduino IDE from http://arduino.cc/en/main/software. When it is installed, follow these instructions to compile and upload the code to your Arduino and perform the following steps:
- Connect your Arduino to your computer and open the Arduino IDE.
- Select File and Open and browse to the
MaplinWeatherInstrumentDriverfolder in the project files. Open the Arduino sketch inside that folder. When loaded, it should look something like the following screenshot: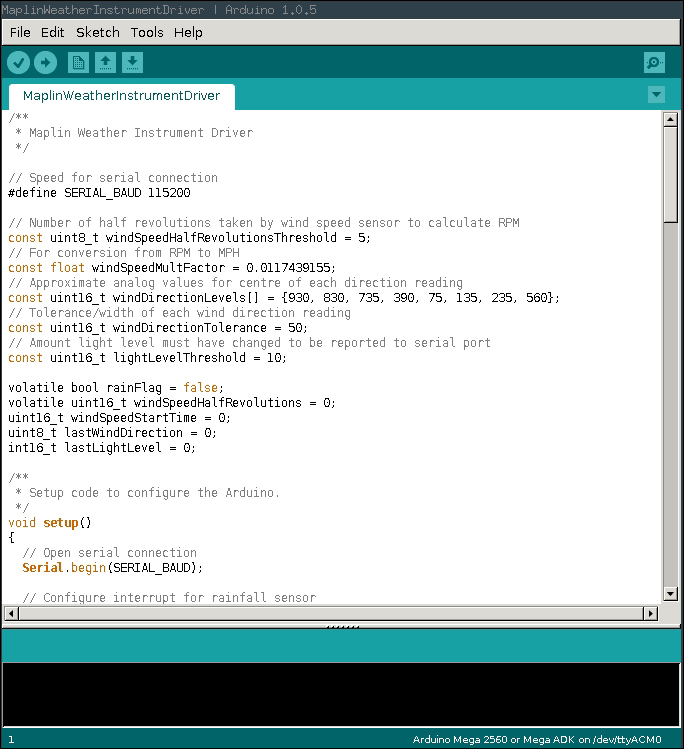
- Select the type of Arduino on which you will be uploading the program by navigating to Tools | Board.
- Select the serial port your Arduino is attached to by navigating to Tools | Serial Port.
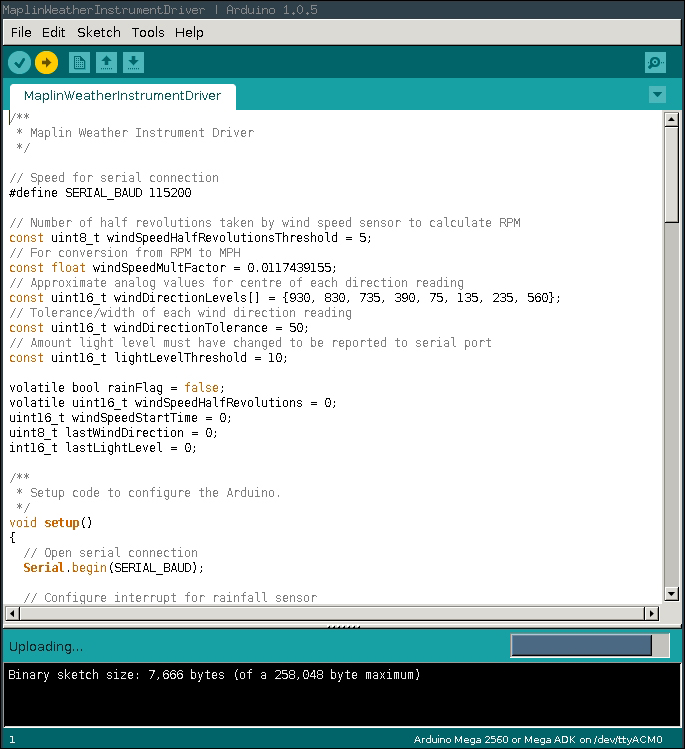
- Now, click on the upload button in the top-left corner of the Arduino IDE. This is the round button with an arrow pointing to the right. The Arduino IDE will then give a message that it is uploading the sketch to the board, as in the following screenshot:
Assuming that the upload is completed successfully, you should see the message Done uploading in the IDE, as shown in the following screenshot:

If you get an error here, then check whether your board and serial port options are correct. If the error still persists, then disconnect your Arduino and restart the Arduino IDE and try again. This usually fixes any problems that occur here.
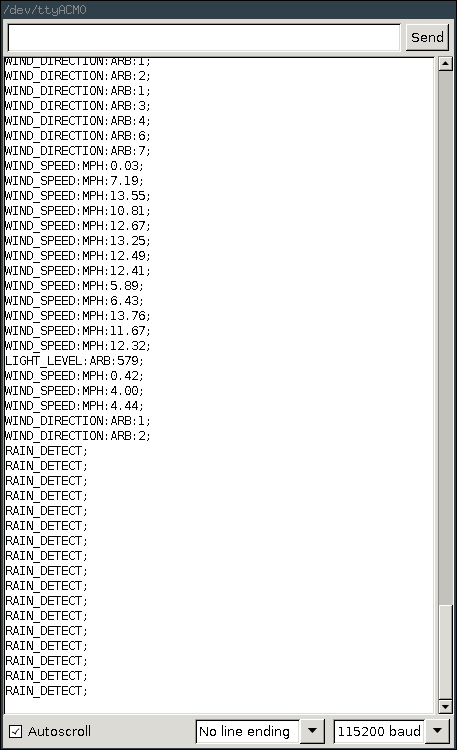
Once the upload is complete, you can open the serial monitor using the button in the top-right corner of the Arduino IDE that has the magnifying glass symbol to check whether the sensors are working correctly. Here, you should be able to manually move the sensors and see the output printed to the serial console.
The following screenshot displays the output printed in the serial console: