
When you first browse to the IP address of the Pi, you are greeted by a page that will look similar to the following screenshot. This shows the current weather conditions that have been recorded over the last measurement period (that is, the period specified by the --submit-interval parameter to the sensor_manager.py script).
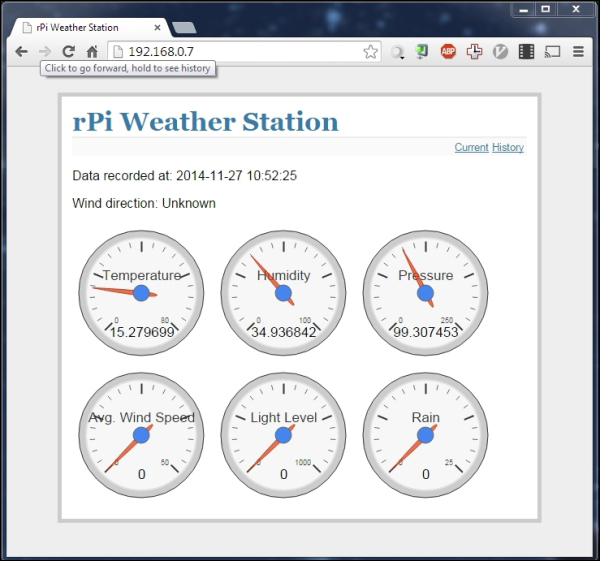
By clicking on the History link in the top-right corner of the page, you are able to browse through all the recordings that have been taken by the weather station.
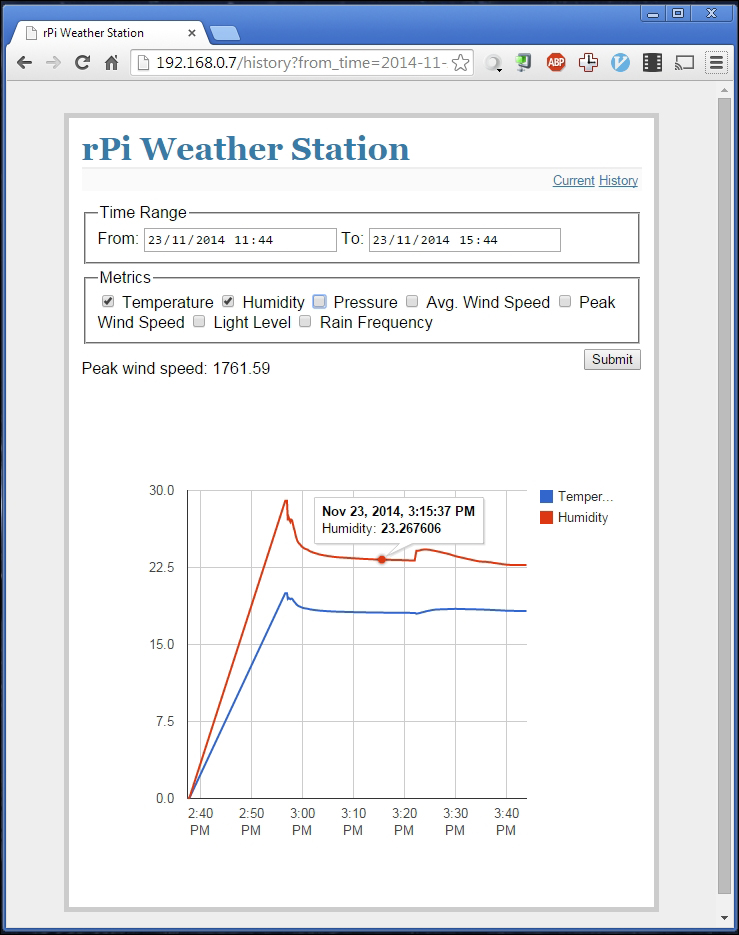
By default, it displays the history for the previous week. This can be changed by using the two options at the top of the page (note that these options may only render correctly in Chrome, Opera, or Safari web browsers).
You can also change which recorded values are to be displayed on the graph by using the selection of checkboxes at the top of the page. Note that some measurements may not be suited to be displayed at the same time as they have different ranges, for example, rainfall and the light level.
If you ever want to take a backup of the weather data, you can do so by taking a copy of the weather.db file in the /home/pi/weather_station_webapp/ directory. If you want to erase all the recorded data, you can simply run the initialize database command again.
Note the units for the measurements: