
The term GIS generally refers to Geographical Information Systems, which are complex computer systems for storing, manipulating, and displaying geo-spatial data. GIS can also be used to refer to the more general Geographic Information Sciences, which is the science surrounding the use of GIS systems.
In this chapter, we will look at:
- The central GIS concepts you will have to become familiar with: location, distance, units, projections, coordinate systems, datums and shapes
- Some of the major data formats you are likely to encounter when working with geo-spatial data
- Some of the processes involved in working directly with geo-spatial data
Working with geo-spatial data is complicated because you are dealing with mathematical models of the Earth's surface. In many ways, it is easy to think of the Earth as a sphere on which you can place your data. That might be easy, but it isn't accurate—the Earth is an oblate spheroid rather than a perfect sphere. This difference, as well as other mathematical complexities we won't get into here, means that representing points, lines, and areas on the surface of the Earth is a rather complicated process.
Let's take a look at some of the key GIS concepts you will become familiar with as you work with geo-spatial data.
Locations represent points on the surface of the Earth. One of the most common ways to measure location is through the use of latitude and longitude coordinates. For example, my current location (as measured by a GPS receiver) is 38.167446 degrees south and 176.234436 degrees east. What do these numbers mean and how are they useful?
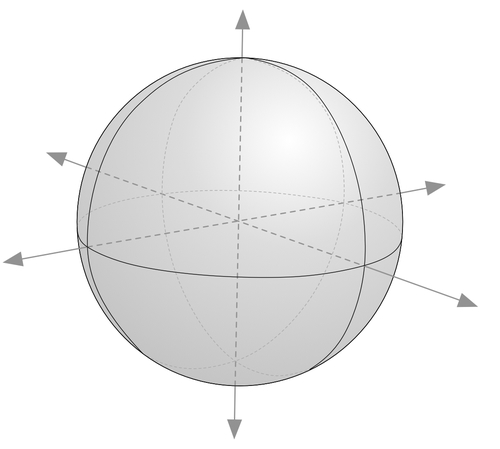
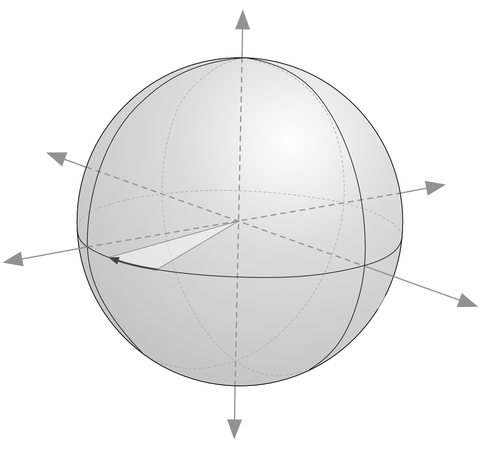
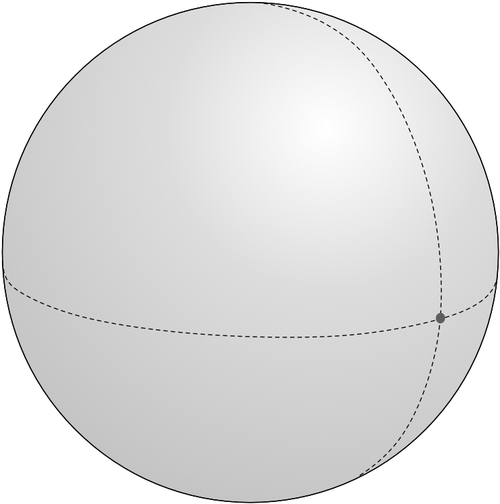
Think of the Earth as a hollow sphere with an axis drawn through its middle:
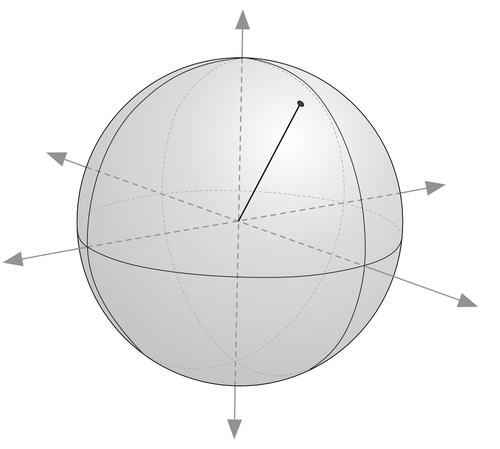
For any given point on the Earth's surface, you can draw a line that connects that point with the centre of the Earth, as shown in the following image:
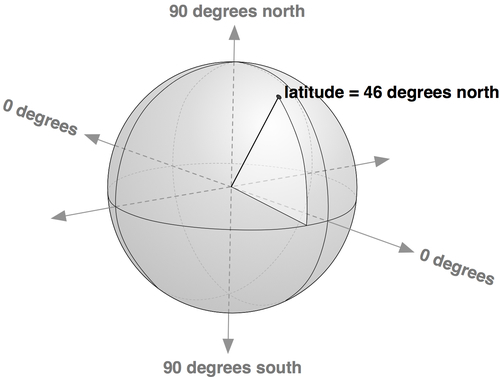
The point's latitude is the angle that this line makes in the north-south direction, relative to the equator:
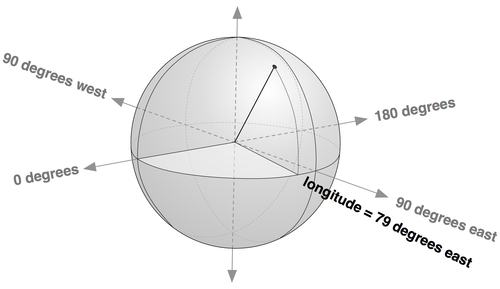
In the same manner, the point's longitude is the angle that this line makes in the east-west direction, relative to an arbitrary starting point (typically the location of the Royal Observatory at Greenwich, England):
By convention, positive latitude values are in the northern hemisphere, while negative latitude values are in the southern hemisphere. Similarly, positive longitude values are east of Greenwich, and negative longitude values are west of Greenwich. Thus, latitudes and longitudes cover the entire Earth like this:
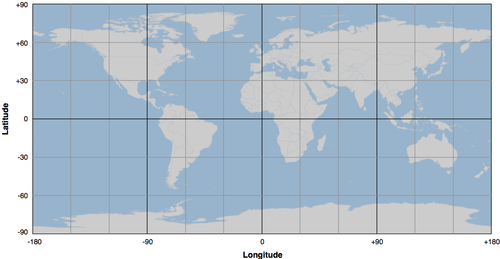
The horizontal lines, representing points of equal latitude, are called parallels, while the vertical lines, representing points of equal longitude, are called meridians. The meridian at zero longitude is often called the prime meridian. By definition, the parallel at zero latitude corresponds with the Earth's equator.
There are two things to remember when working with latitude and longitude values:
- Western longitudes are generally negative, but you may find situations (particularly when dealing with US-specific data) where western longitudes are given as positive values.
- The longitude values wrap around at the ±180 degrees point. That is, as you travel east, your longitude will go 177, 178, 179, 180, -179, -178, -177, and so on. This can make basic distance calculations rather confusing if you are doing them yourself rather than relying on a library to do the work for you.
A latitude and longitude value refers to what is called a geodetic location. A geodetic location identifies a precise point on the Earth's surface, regardless of what might be at that location. While much of the data we will be working with involves geodetic locations, there are other ways of describing a location which you may encounter. For example, a civic location is simply a street address, which is another perfectly valid (though less scientifically precise) way of defining a location. Similarly, jurisdictional locations include information about which governmental boundary (such as an electoral ward, borough, or city) the location is within. This information is important in some contexts.
The distance between two points can be thought of in different ways. For example:
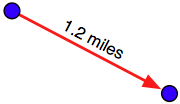
- This is often described as an "as the crow flies" distance. We'll discuss this in more detail shortly, though be aware that linear distances aren't quite as simple as they might appear.
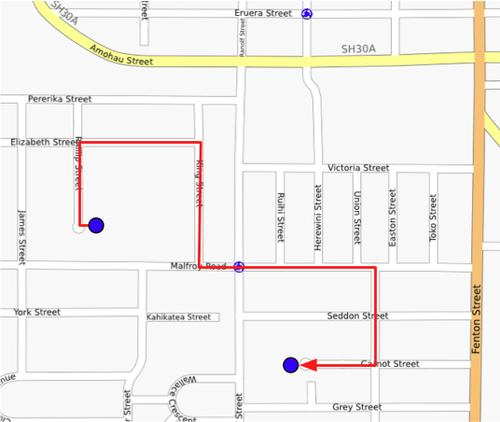
- Traveling Distance: Linear ("as the crow flies") distances are all very well, but very few people can fly like crows. Another useful way of measuring distance is to measure how far you would actually have to travel to get from one point to another, typically following a road or other obvious route:
Most of the time, you will be dealing with linear distances. If the Earth was flat, linear distances would be trivial to calculate—you simply measure the length of a line drawn between the two points. Of course, the Earth is not flat, which means that actual distance calculations are rather more complicated:
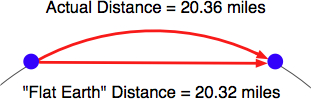
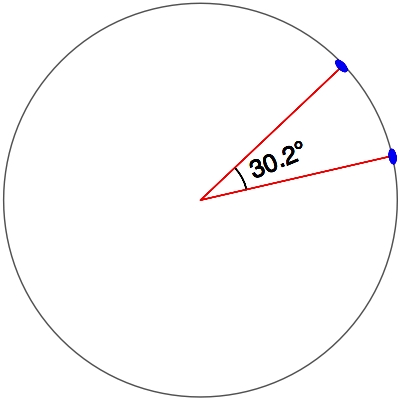
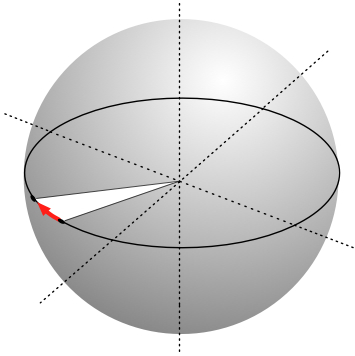
Because we are working with distances between points on the Earth's surface rather than points on a flat surface, we are actually using what is called the great circle distance. The great circle distance is the length of a semicircle going between two points on the surface of the earth, where the semicircle is centered around the middle of the earth:
It is relatively straightforward to calculate the great circle distance between any two points if you assume that the Earth is spherical; the Haversine formula is often used for this. More complicated techniques that more accurately represent the shape of the Earth are available, though in many cases the Haversine formula is sufficient.
In September 1999, the Mars Climate Orbiter reached the outer edges of the Martian atmosphere, after having traveled through space for 286 days and costing a total of $327 million to create. As it approached its final orbit, a miscalculation caused it to fly too low, and the Orbiter was destroyed. The reason? The craft's thrusters were calculating force using imperial units, while the spacecraft's computer worked with metric units. The result was a disaster for NASA, and a pointed reminder of just how important it is to understand which units your data is in.
Geo-spatial data can come in a variety of different units. Distances can be measured in metric and imperial, of course, but there are actually a lot of different ways in which a given distance can be measured. These include:
- Millimeters
- Centimeters
- Inches
- International feet
- U.S. survey feet
- Meters
- Yards
- Kilometers
- International miles
- U.S. survey (statute) miles
- Nautical miles
Whenever you are working with distance data, it's important that you know which units those distances are in. You will also often find it necessary to convert data from one unit of measurement to another.
Angular measurements can also be in different units: degrees or radians. Once again, you will often have to convert from one to the other.
While these are not strictly speaking different units, you will often need to convert longitude and latitude values because of the various ways these values can be represented. Traditionally, longitude and latitude values have been written using "degrees, minutes, and seconds" notation, like this:
176° 14' 4''
Another possible way of writing these numbers is to use "degrees and decimal minutes" notation:
176° 14.066'
Finally, there is the "decimal degrees" notation:
176.234436°
Decimal degrees are quite common now, mainly because these are simply floating-point numbers you can put directly into your programs, but you may also need to convert longitude and latitude values from other formats before you can use them.
Another possible issue with longitude and latitude values is that the quadrant (east, west, north, south) can sometimes be given as a separate value rather than using positive or negative values. For example:
176.234436° E
Fortunately, all these conversions are relatively straightforward. But it is important to know which units, and in which format your data is in—your software may not crash a spacecraft, but it will produce some very strange and incomprehensible results if you aren't careful.
Creating a two-dimensional map from the three-dimensional shape of the Earth is a process known as projection. A projection is a mathematical transformation that unwraps the three-dimensional shape of the Earth and places it onto a two-dimensional plane.
Hundreds of different projections have been developed, but none of them are perfect. Indeed, it is mathematically impossible to represent the three-dimensional Earth's surface on a two-dimensional plane without introducing some sort of distortion; the trick is to choose a projection where the distortion doesn't matter for your particular use. For example, some projections represent certain areas of the Earth's surface accurately while adding major distortion to other parts of the Earth; these projections are useful for maps in the accurate portion of the Earth, but not elsewhere. Other projections distort the shape of a country while maintaining its area, while yet other projections do the opposite.
There are three main groups of projections: cylindrical, conical, and azimuthal. Let's look at each of these briefly.
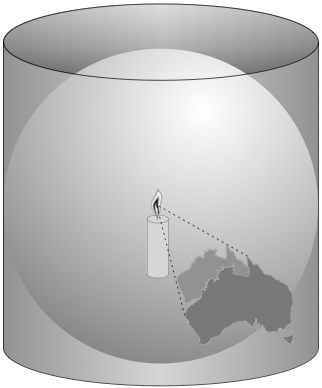
An easy way to understand cylindrical projections is to imagine that the Earth is like a spherical Chinese lantern, with a candle in the middle:
If you placed this lantern-Earth inside a paper cylinder, the candle would "project" the surface of the Earth onto the inside of the cylinder:
You can then "unwrap" this cylinder to obtain a two-dimensional image of the Earth:
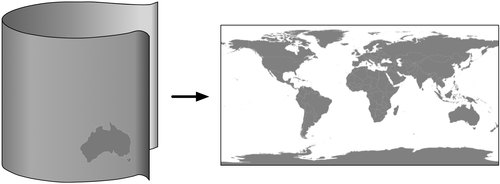
Of course, this is a simplification—in reality, map projections don't actually use light sources to project the Earth's surface onto a plane, but instead use sophisticated mathematical transformations that result in less distortion. But the concept is the same.
Some of the main types of cylindrical projections include the Mercator Projection, the Equal-Area Cylindrical Projection, and the Universal Transverse Mercator Projection.
A conic projection is obtained by projecting the Earth's surface onto a cone:
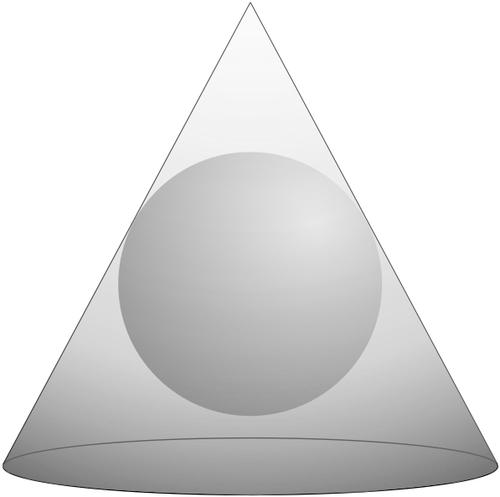
Some of the more common types of conic projections include the Albers Equal-Area Projection, the Lambert Conformal Conic Projection, and the Equidistant Projection.
An azimuthal projection involves projecting the Earth's surface directly onto a flat surface:
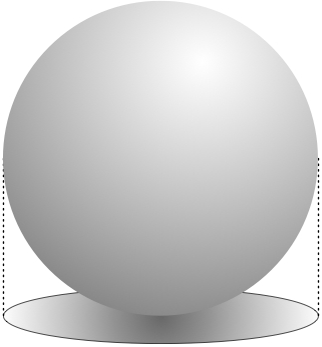
Azimuthal projections are centered around a single point, and don't generally show the entire Earth's surface. They do, however, emphasize the spherical nature of the Earth. In many ways, azimuthal projections depict the Earth as it would be seen from space.
Some of the main types of azimuthal projections include the Gnomonic Projection, the Lambert Equal-Area Azimuthal Projection, and the Orthographic Projection.
As mentioned earlier, there is no such thing as a perfect projection—every projection distorts the Earth's surface in some way. Indeed, the mathematician Carl Gausse proved that it is mathematically impossible to project a three-dimensional shape such as a sphere onto a flat plane without introducing some sort of distortion. This is why there are so many different types of projections—some projections are more suited to a given purpose, but no projection can do everything.
Whenever you create or work with geo-spatial data, it is essential that you know which projection has been used to create that data. Without knowing the projection, you won't be able to plot data or perform accurate calculations.
Closely related to map projection is the concept of a coordinate system. There are two types of coordinate systems you will need to be familiar with: projected coordinate systems and unprojected coordinate systems.
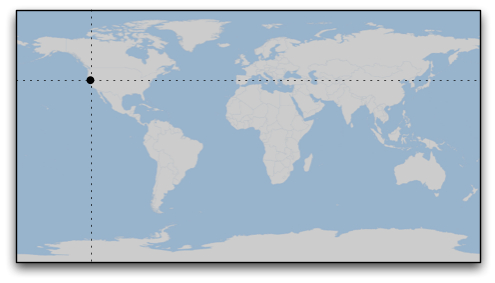
Latitude and longitude values are an example of an unprojected coordinate system. These are coordinates that directly refer to a point on the Earth's surface:
Unprojected coordinates are useful because they can accurately represent a desired point on the Earth's surface, but they also make it very difficult to perform distance and other geo-spatial calculations.
Projected coordinates, on the other hand, are coordinates that refer to a point on a two-dimensional map that represents the surface of the Earth:
A projected coordinate system, as the name implies, makes use of a map projection to first convert the Earth into a two-dimensional Cartesian plane, and then places points onto that plane. To work with a projected coordinate system, you need to know which projection was used to create the underlying map.
For both projected and unprojected coordinates, the coordinate system also implies a set of reference points that allow you to identify where a given point will be. For example, the unprojected lat/long coordinate system represents the longitude value of zero by a line running north-south through the Greenwich observatory in England. Similarly, a latitude value of zero represents a line running around the equator of the Earth.
For projected coordinate systems, you typically define an origin and the map units. Some coordinate systems also use false northing and false easting values to adjust the position of the origin, as shown in the following figure:
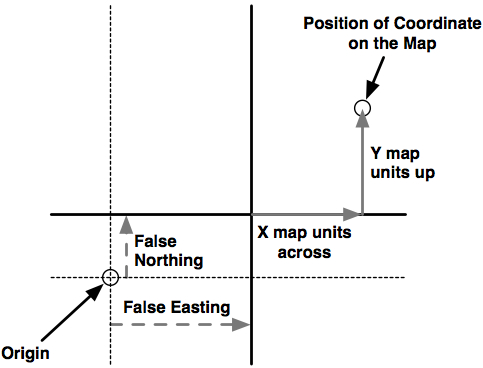
To give a concrete example, the Universal Transverse Mercator (UTM) coordinate system divides the world up into 60 different "zones", each zone using a different map projection to minimize projection errors. Within a given zone, the coordinates are measured as the number of meters away from the zone's origin, which is the intersection of the equator and the central meridian for that zone. False northing and false easting values are then added to the distance in meters away from this reference point to avoid having to deal with negative numbers.
As you can imagine, working with projected coordinate systems such as this can get quite complicated. However, the big advantage of projected coordinates is that it is easy to perform geo-spatial calculations using these coordinates. For example, to calculate the distance between two points, both using the same UTM coordinate system, you simply calculate the length of the line between them, which is the distance between the two points, in meters. This is ridiculously easy compared with the work required to calculate distances using unprojected coordinates.
Of course, this assumes that the two points are both in the same coordinate system. Since projected coordinate systems are generally only accurate over a relatively small area, you can get into trouble if the two points aren't both in the same coordinate system (for example, if they are in two different UTM zones). This is where unprojected coordinate systems have a big advantage—they cover the entire Earth.
Roughly speaking, a datum is a mathematical model of the Earth used to describe locations on the Earth's surface. A datum consists of a set of reference points, often combined with a model of the shape of the Earth. The reference points are used to describe the location of other points on the Earth's surface, while the model of the Earth's shape is used when projecting the Earth's surface onto a two-dimensional plane. Thus, datums are used by both map projections and coordinate systems.
While there are hundreds of different datums in use throughout the world, most of these only apply to a localized area. There are three main reference datums that cover larger areas and which you are likely to encounter when working with geo-spatial data:
- NAD 27: This is the North American datum of 1927. It includes a definition of the Earth's shape (using a model called the Clarke Spheroid of 1866) and a set of reference points centered around Meades Ranch in Kansas. NAD 27 can be thought of as a local datum covering North America.
- NAD 83: The North American datum of 1983. This datum makes use of a more complex model of the Earth's shape (the 1980 Geodetic Reference System, GRS 80). NAD 83 can be thought of as a local datum covering the United States, Canada, Mexico, and Central America.
- WGS 84: The World geodetic system of 1984. This is a global datum covering the entire Earth. It makes use of yet another model of the Earth's shape (the Earth Gravitational Model of 1996, EGM 96) and uses reference points based on the IERS International Reference Meridian. WGS 84 is a very popular datum. When dealing with geo-spatial data covering the United States, WGS 84 is basically identical to NAD 83. WGS 84 also has the distinction of being used by Global Positioning System satellites, so all data captured by GPS units will use this datum.
While WGS 84 is the most common datum in use today, a lot of geo-spatial data makes use of other datums. Whenever you are dealing with a coordinate value, it is important to know which datum was used to calculate that coordinate. A given point in NAD 27, for example, may be several hundred feet away from that same coordinate expressed in WGS 84. Thus, it is vital that you know which datum is being used for a given set of geo-spatial data, and convert to a different datum where necessary.
Geo-spatial data often represents shapes in the form of points, paths, and outlines:
A point, of course, is simply a coordinate, described by two or more numbers within a projected or unprojected coordinate system.
A path is generally described using what is called a linestring:
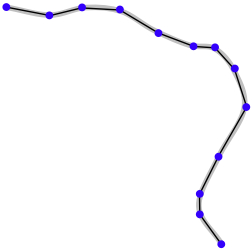
A linestring represents a path as a connected series of line segments. A linestring is a deliberate simplification of a path, a way of approximating the curving path without having to deal with the complex maths required to draw and manipulate curves. Linestrings are often used in geo-spatial data to represent roads, rivers, contour lines, and so on.
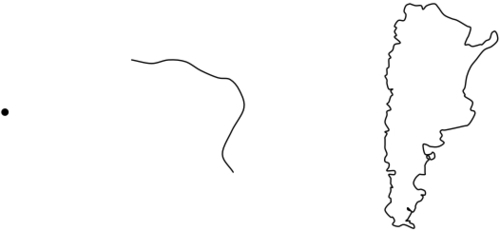
An outline is often represented in geo-spatial data using a polygon:
As with linestrings, polygons are described as a connected series of line segments. The only difference is that the polygon is closed; that is, the last line segment finishes where the first line segment starts. Polygons are commonly used in geo-spatial data to describe the outline of countries, lakes, cities, and more.