
One of the most enthralling aspects of programs such as Google Earth is the ability to see the Earth as you appear to fly above it. This is achieved by displaying satellite and aerial photographs carefully stitched together to provide the illusion that you are viewing the Earth's surface from above.
While writing your own version of Google Earth would be an almost impossible task, it is possible to obtain free satellite imagery in the form of raster format geo-spatial data, which you can then use in your own geo-spatial applications.
Raster data is not just limited to images of the Earth's surface, however. Other useful information can be found in raster format—for example, Digital Elevation Map (DEM) files contain the height of each point on the Earth's surface, which can then be used to calculate the elevation of any desired point. DEM data can also be used to generate pseudo-3D images by using different colors to represent different heights.
In this section, we will look at both an extremely comprehensive source of satellite imagery, and some freely-available sources of digital elevation data.
Landsat is an ongoing effort to collect images of the Earth's surface. A group of dedicated satellites have been continuously gathering images of the Earth's surface since 1972. Landsat imagery includes black and white, traditional red/green/blue (RGB) color images, as well as infrared and thermal imaging. The color images are typically at a resolution of 30 meters per pixel, while the black and white images from Landsat 7 are at a resolution of 15 meters per pixel.
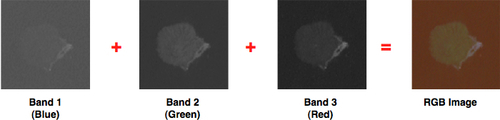
The following illustration shows color-corrected Landsat satellite imagery for Rotorua, New Zealand:

Landsat images are typically available in the form of GeoTIFF files. GeoTIFF is a geo-spatially tagged TIFF image file format, allowing images to be georeferenced onto the Earth's surface. Most GIS software and tools, including GDAL, are able to read GeoTIFF formatted files.
Because the images come directly from a satellite, the files you can download typically store separate bands of data in separate files. Depending on the satellite the data came from, there can be up to eight different bands of data—for example, Landsat 7 generates separate Red, Green, and Blue bands, as well as three different infrared bands, a thermal band, and a high-resolution panchromatic (black-and-white) band.
To understand how this works, let's take a closer look at the process required to create the image shown above. The raw satellite data consists of eight separate GeoTIFF files, one for each band. Band 1 contains the blue color data, Band 2 contains the green color data, and Band 3 contains the red color data. These separate files can then be combined using GDAL to produce a single color image:
Another complication with the Landsat data is that the images produced by the satellites are distorted by various factors, including the ellipsoid shape of the Earth, the elevation of the terrain being photographed, and the orientation of the satellite as the image is taken. The raw data is therefore not a completely accurate representation of the features being photographed. Fortunately, a process known as orthorectification can be used to correct these distortions. In most cases, orthorectified versions of the satellite images can be downloaded directly.
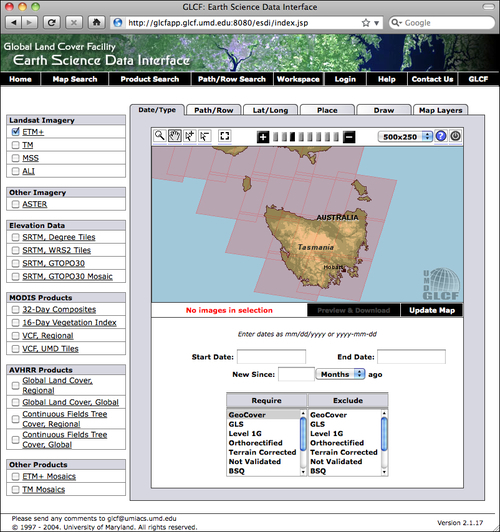
The easiest way to access Landsat imagery is to make use of the University of Maryland's Global Land Cover Facility website:
Click on the ESDI Download link, and then click on Map Search. Select ETM+ from the Landsat imagery list, and if you zoom in on the desired part of the Earth you will see the areas covered by various Landsat images:
If you choose the selection tool (![]() ) you will be able to click on a desired area, then select Preview and Download to choose the image to download.
) you will be able to click on a desired area, then select Preview and Download to choose the image to download.
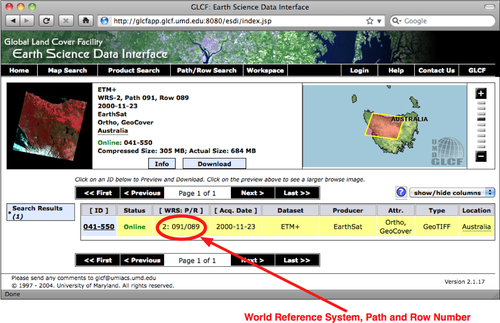
Alternatively, if you know the path and row number of the desired area of the Earth, you can directly access the files via FTP. The path and row number (as well as the WRS or "world reference system" used by the data) can be found on the Preview & Download page:
If you want to download the image files via FTP, the main FTP site is at:
ftp://ftp.glcf.umd.edu/glcf/Landsat
The directories and files have complex names that include the WRS, the path and row number, the satellite number, the date at which the image was taken, and the band number. For example, a file named:
p091r089_7t20001123_z55_nn10.tif.gz
Refers to path 91 and row 89, which happens to be the portion of Tasmania highlighted in the above image. The 7 refers to the number of the Landsat satellite that took the image, and 20001123 is a datestamp indicating when the image was taken. The final part of the file name, nn10, tells us that the file is for Band 1.
By interpreting the file name in this way, you can download the correct files, and match the files against the desired bands.
GLOBE (Global Land One-kilometer Base Elevation) is an international effort to produce high-quality, medium-resolution digital elevation (DEM) data for the entire world. The result is a set of freely-available DEM files which can be used for many types of geo-spatial analysis and development.
The following illustration shows GLOBE DEM data for northern Chile, converted to a grayscale image:
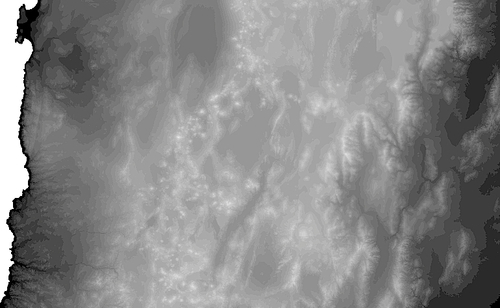
Like all DEM data, GLOBE uses raster values to represent the elevation at a given point on the Earth's surface. In the case of GLOBE, this data consists of 32-bit signed integers representing the height above (or below) sea level, in meters. Each cell or "pixel" within the raster data represents the elevation of a square on the Earth's surface which is 30 arc-seconds of longitude wide and 30 arc-seconds of latitude high:
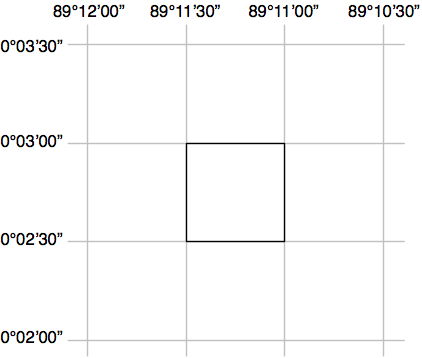
Note that 30 arc-seconds equals approximately 0.00833 degrees of latitude or longitude, which equates to a square roughly one kilometer wide and one kilometer high.
The raw GLOBE data is simply a long list of 32-bit integers in big-endian format, where the cells are read left-to-right and then top-to-bottom, like this:
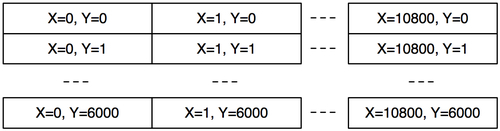
A separate header (.hdr) file provides more detailed information about the DEM data, including the width and height and its georeferenced location. Tools such as GDAL are able to read the raw data as long as the header file is provided.
The main website for the GLOBE project can be found at:
http://www.ngdc.noaa.gov/mgg/topo/globe.html
As well as detailed documentation for the GLOBE data, you can follow the Get Data Online link to download precalculated sets of data or to choose a given area to download DEM data for.
If you download one of the premade tiles, you will need to also download the associated .hdr file so that the data can be georeferenced and processed using GDAL. If you choose a custom area to download, a suitable .hdr file will be created for you—just make sure you choose an export type of ESRI ArcView so that the header is created in the format expected by GDAL.
If you download a premade tile, the header files can be quite hard to find. Suitable header files in ESRI format can be downloaded from:
http://www.ngdc.noaa.gov/mgg/topo/elev/esri/hdr
Once you have downloaded the data, simply place the raw DEM file into the same directory as the .hdr file. You can then open the file directly using GDAL, like this:
import osgeo.gdal
dataset = osgeo.gdal.Open("j10g.bil")
The dataset will consist of a single band of raster data, which you can then translate, read, or process using the GDAL library and related tools.
Note
To see an example of using GDAL to process DEM data, please refer to the GDAL section in Chapter 3.
The National Elevation Dataset (NED) is a high-resolution digital elevation dataset provided by the US Geological Survey. It covers the Continental United States, Alaska, Hawaii, and other US territories. Most of the United States is covered by elevation data at 30 meters/pixel or 10 meters/pixel resolution, with selected areas available at 3 meters/pixel. Alaska is generally only available at 60 meters/pixel resolution.
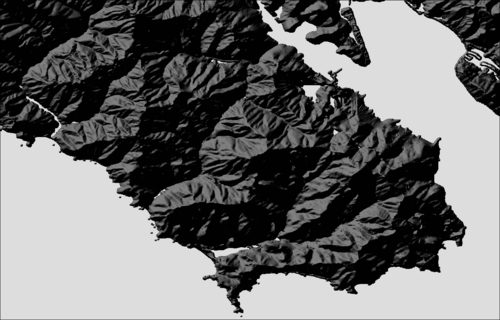
The following shaded relief image was generated using NED elevation data for the Marin Headlands, San Francisco:
NED data is provided in ARC/Info Binary Grid (.adf) format, which is called ArcGRID on the USGS website. This binary format is used internally by the ARC/Info GIS system. Fortunately, the ArcGRID format has been reverse-engineered, and drivers are available for GDAL to read data in this format.
As with other DEM data, each "pixel" in the raster image represents the height of a given area on the Earth's surface. For NED data, the height is in meters above or below a reference height known as the North American Vertical Datum of 1988. This roughly equates to the height above sea level, allowing for tidal and other variations.
NED data can be downloaded from the main NED website:
There are two options for downloading the elevation data:
- Choosing a prepackaged set of tiles by selecting the desired state and county or minimum and maximum lat/long values
- Using the National Map Seamless Server applet
Either option will work—the prepackaged tiles have the disadvantage that they are split into separate tiles, and include a six-pixel overlap at the edges of each tile. Using the Seamless Server returns all the data in one chunk, though the interface is a bit awkward to use and is limited in the amount of information that can be downloaded at any one time.
To download data using the Seamless Server, you first have to do the following:
- Pan and zoom to display the area you want to download DEM data for.
- Click on the Download link in the upper-right corner and choose the resolution for the elevation data you want to download.
-
You then click on the Define Rectangular Download Area tool (
 ) and drag a box around the area you want to download data for.
- A separate window then appears showing you the area you have selected. If you want, you can change the format of the downloaded data by clicking on the Modify Data Request hyperlink. The interface is quite confusing, but allows you to choose which format the data should be downloaded in, as well as compression and metadata options.
- Finally, click on the Download button and your web browser will download the selected data once it has been extracted.
If you use the default download options, you will receive a ZIP file containing more than 20 separate files. Many of these files contain metadata and documentation; the ArcGRID files that contain the actual elevation data all end with the suffix .adf. Move these files into a separate directory, making sure to place all the .adf files in the same directory, and you will be able to read the elevation data from these files using GDAL.
Tip
On non-Windows machines, you may need to remove the backslashes from the filenames before GDAL will recognize them
Once you have the ArcGRID datafiles, you can open them in GDAL just like you would open any other dataset:
import osgeo.gdal
dataset = osgeo.gdal.Open("hdr.adf")
Finally, if you are working with DEM data, you might like to check out the gdaldem utility which is included as part of the GDAL download. This program makes it easy to view and manipulate DEM raster data. The shaded relief image shown above was created using this utility, like this:
gdaldem hillshade hdr.adf hillshade.tiff