
Now that we have the data, we can start to implement the DISTAL application itself. To keep things simple, we will use CGI scripts to implement the user-interface.
Note
CGI scripts aren't the only way we could implement the DISTAL application. Other possible approaches include using web application frameworks such as TurboGears or Django, using AJAX to write your own dynamic web application, or even using tools such as Pyjamas (http://pyjs.org) to compile Python code into JavaScript. All of these approaches, however, are more complicated than CGI, and we will be making use of CGI scripts in this chapter to keep the code as straightforward as possible.
Let's take a look at how our CGI scripts will implement the DISTAL application's workflow:
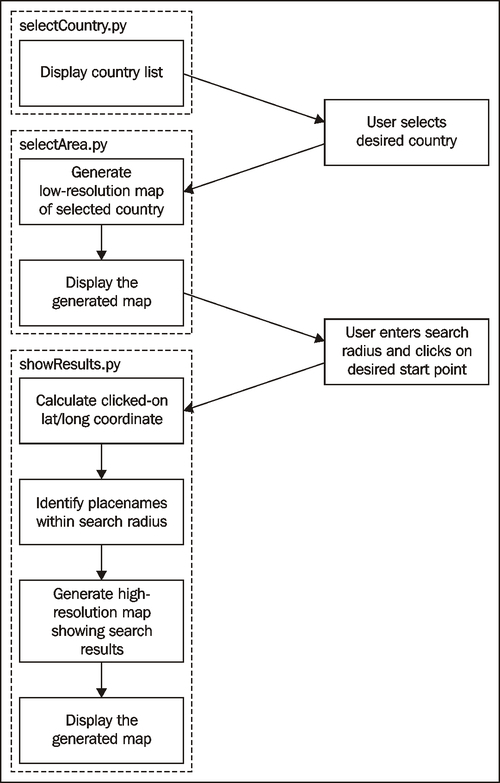
As you can see, there are three separate CGI scripts: selectCountry.py, selectArea.py, and showResults.py, each implementing a distinct part of the DISTAL application. Let's work through the implementation of each of these scripts in turn.
Tip
What is a CGI Script?
While the details of writing CGI scripts is beyond the scope of this book, the basic concept is to print the raw HTML output to stdout, and to process CGI parameters from the browser using the built-in cgi module. For more information, see one of the CGI tutorials commonly available on the Internet, for example: http://wiki.python.org/moin/CgiScripts.
If you don't already have a web server capable of running CGI scripts, it's trivial to set one up—simply copy the following code into a Python program, which we will call webServer.py:
import BaseHTTPServer
import CGIHTTPServer

address = ('', 8000)
handler = CGIHTTPServer.CGIHTTPRequestHandler
server = BaseHTTPServer.HTTPServer(address, handler)
server.serve_forever()
Then, in the same directory as the webServer.py program, create a sub-directory named cgi-bin. This sub-directory will hold the various CGI scripts you create.
Running webServer.py will set up a web server at http://127.0.0.1:8000 that will execute any CGI scripts you place into the cgi-bin sub-directory. So, for example, to access the selectCountry.py script, you would enter the following URL into your web browser: http://127.0.0.1:8000/cgi-bin/selectCountry.py
The task of the selectCountry.py script is to display a list of countries to the user so that the user can choose a desired country, which is then passed on to the selectArea.py script for further processing.
Here is what the selectCountry.py script's output will look like:
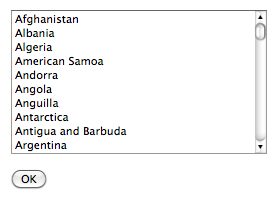
This CGI script is very basic: we simply print out the contents of the HTML page that lets the user choose a country from a list of country names:
print 'Content-Type: text/html; charset=UTF-8

'
print '<html>'
print '<head><title>Select Country</title></head>'
print '<body>'
print '<form method="POST" action="selectArea.py">'
print '<select name="countryID" size="10">'

cursor.execute("SELECT id,name FROM countries ORDER BY name")
for id,name in cursor:
    print '<option value="'+str(id)+'">'+name+'</option>'

print '</select>'
print '<p>'
print '<input type="submit" value="OK">'
print '</form>'
print '</body>'
print '</html>'
Note that the code to access the database is the same for MySQL, PostGIS, and SpatiaLite, so this script will work the same on all three databases.
Tip
A Crash Course in HTML Forms
If you haven't used HTML forms before, don't panic. They are quite straightforward, and if you want you can just copy the code from the examples given here. The following brief overview may also help you to understand how these forms work.
An HTML form is surrounded by<form> and</form> tags defining the start and end of the form's definition. The action="..." attribute tells the browser where to send the submitted data, and the method="..." attribute tells the browser how to submit the data. In this case, we are setting up a form that will use an HTTP POST request to send the submitted form parameters to a CGI script named selectArea.py.
The contents of a form are made up of ordinary HTML elements, such as textual labels and images, combined with special form-specific elements. There are two types of form-specific elements we are interested in here: the<select> element, which displays a list of the available countries, and the<input> element, which in this case displays an OK button.
For each country, the<select> element includes an<option> element listing the name of the country and its associated record ID. When the user selects a country (by choosing that country's name from the list), the associated record ID will be submitted as a parameter named countryID when the user clicks on the OK button.
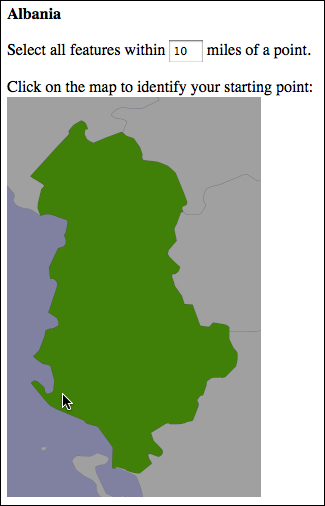
The next part of the DISTAL application is selectArea.py. This script generates a web page that displays a simple map of the selected country. The user can enter a desired search radius and click on the map to identify the starting point for the DISTAL search:
In order to display a map like this, we need to use a map renderer to convert the raw geo-spatial data into an image file. Map rendering using the Mapnik toolkit will be covered in detail in Chapter 8, Using Python and Mapnik to Generate Maps; for now, we are going to create a standalone mapGenerator.py module which does the map rendering for us so that we can focus on the other aspects of the DISTAL application.
There are four parts to generating a map:
- Calculating the bounding box which defines the portion of the world to be displayed.
- Calculating the map's dimensions.
- Setting up the datasource.
- Rendering the map image.
Let's look at each of these in turn.
Before we can show the selected country on a map, we need to calculate the bounding box for that country—that is, the minimum and maximum latitude and longitude values. Knowing the bounding box allows us to draw a map centered over the desired country. If we didn't do this, the map would cover the entire world.
Given the internal record ID for a country, we can use the following code to retrieve the bounding box:
cursor.execute("SELECT AsText(Envelope(outline)) " +
               "FROM countries where id=%s", (countryID,))
row = cursor.fetchone()
if row != None:
    envelope = shapely.wkt.loads(row[0])
    minLong,minLat,maxLong,maxLat = envelope.bounds
Note
This code uses MySQL. For PostGIS, replace AsText with ST_AsText and Envelope with ST_Envelope. For SpatiaLite, replace %s with ?.
The AsText(Envelope(outline)) expression calculates the bounding box for the selected country (in the form of a Polygon object), and retrieves it in WKT format. Note that we convert the WKT text into a Shapely Geometry object, which allows us to retrieve the minimum and maximum lat/long values using envelope.bounds.
The bounding box isn't useful only to zoom in on the desired part of the map. It also helps us to correctly define the map's dimensions. Notice that the previous map of Albania shows the country as being taller than it is wide. If you were to naïvely draw this map as a square image, Albania would end up looking like this:
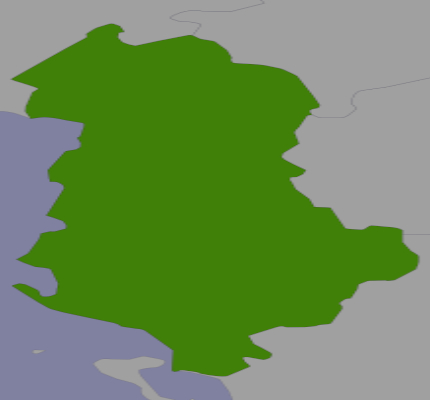
Even worse, Chile would look like this:
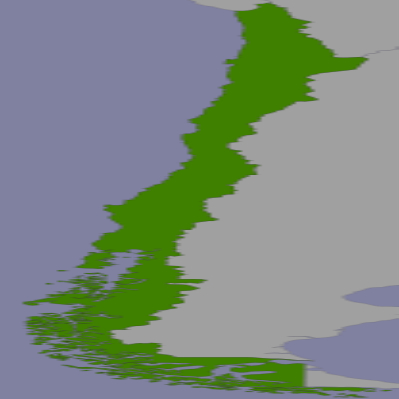
rather than:

Note
This is a slight simplification; the mapping toolkits generally do try to preserve the aspect ratio for a map, but their behavior is unpredictable and means that you can't identify the lat/long coordinates for a clicked-on point.
To display the country correctly, we need to calculate the country's aspect ratio (its width as a proportion of its height) and then calculate the size of the map image based on this aspect ratio, while limiting the overall size of the image so that it can fit within a web page. Here's the necessary code:
MAX_WIDTH = 600
MAX_HEIGHT = 400

...

width = float(maxLong - minLong)
height = float(maxLat - minLat)
aspectRatio = width/height

mapWidth = MAX_WIDTH
mapHeight = int(mapWidth / aspectRatio)

if mapHeight > MAX_HEIGHT:
    # Scale the map to fit.
    scaleFactor = float(MAX_HEIGHT) / float(mapHeight)
    mapWidth = int(mapWidth * scaleFactor)
    mapHeight = int(mapHeight * scaleFactor)
Doing this means that the map is correctly sized to reflect the dimensions of the country we are displaying.
The datasource tells the map generator how to access the underlying map data. How datasources work is beyond the scope of this chapter; for now, we are simply going to set up the required datasource dictionary and related files so that we can generate our map. Note that the contents of this dictionary will vary depending on which database you are using, as well as which table you are trying to access; in this case, we are trying to display selected features from the countries table.
To render maps using data in a MySQL database, you have to set up a special file called a "virtual datasource" to tell the map generator how to access the data. Create a file named countries.vrt in the same directory as your main script, and enter the following into this file:
<OGRVRTDataSource>
  <OGRVRTLayer name="countries">
    <SrcDataSource>MYSQL:distal,user=USER,passwd=PASS
        tables=countries</SrcDataSource>
    <SrcSQL>SELECT id,outline FROM countries</SrcSQL>
  </OGRVRTLayer>
</OGRVRTDataSource>
Don't forget to replace USER with the username and PASS with the password used to access your MySQL database. Also, make sure all the text from<SrcDataSource> to</SrcDataSource> is on a single line.
Now that we have the virtual datasource file, we can go ahead and set up the MySQL datasource dictionary using the following code:
vrtFile = os.path.join(os.path.dirname(__file__),
                       "countries.vrt")

datasource = {'type'  : "OGR",
              'file'  : vrtFile,
              'layer' : "countries"}
Setting up the datasource dictionary for a PostGIS database is straightforward:
datasource = {'type'     : "PostGIS",
              'dbname'   : "distal",
              'table'    : "countries",
              'user'     : "USER",
              'password' : "PASS"}
Obviously, you should replace USER and PASS with the username and password used to access your PostGIS database.
Obtaining map data from a SpatiaLite database is also straightforward. The only trick is that we have to include the full path to the SpatiaLite database file, so we use __file__ to avoid hardcoding path names into our script:
dbFile = os.path.join(os.path.dirname(__file__),
                      "distal.db")

datasource = {'type'           : "SQLite",
              'file'           : dbFile,
              'table'          : "countries",
              'geometry_field' : "outline",
              'key_field'      : "id"}
With the bounding box, the map's dimensions, and the datasource all set up, we are finally ready to render the map into an image file. This is done using a single function call:
imgFile = mapGenerator.generateMap(datasource,
                                   minLong, minLat,
                                   maxLong, maxLat,
                                   mapWidth, mapHeight,
                                   "[id] = "+str(countryID))
Note that our datasource has been set up to display features from the countries table, and that"[id] = "+str(countryID) is a "highlight expression" used to visually highlight the country with the given ID.
The mapGenerator.generateMap() function returns a reference to a PNG-format image file containing the generated map. This image file is stored in a temporary directory, and the file's relative pathname is returned to the caller. This allows us to use the returned imgFile directly within our CGI script, like this:
print 'Content-Type: text/html; charset=UTF-8

'
print '<html>'
print '<head><title>Select Area</title></head>'
print 'vbody>"
print '<b>' + name + '</b>'
print '<p>'
print '<form method="POST" action="...">'
print 'Select all features within'
print '<input type="text" name="radius" value="10" size="2">'
print 'miles of a point.'
print '<p>'
print 'Click on the map to identify your starting point:'
print '<br>'
print '<input type="image" src="' + imgFile + '" ismap>'
print '<input type="hidden" name="countryID"'
print '       value="' + str(countryID) + '">'
print '<input type="hidden" name="mapWidth"'
print '       value="' + str(mapWidth) + '">'
print '<input type="hidden" name="mapHeight"'
print '       value="' + str(mapHeight) + '">'
print '</form>'
print '</body></html>'
Note
The<input type="hidden"> lines define "hidden form fields" that pass information on to the next CGI script. We'll discuss how this information is used in the next section.
The use of<input type="image" src="..." ismap> in this CGI script has the interesting effect of making the map clickable: when the user clicks on the image, the enclosing HTML form will be submitted with two extra parameters named x and y. These contain the coordinate within the image that the user clicked on.
This completes the selectArea.py CGI script. Before it will run, you will also need to download or type in the mapGenerator.py module, the source code of which is given below:
# mapGenerator.py

import os, os.path, sys, tempfile
import mapnik

def generateMap(datasource, minX, minY, maxX, maxY,
                mapWidth, mapHeight,
                hiliteExpr=None, background="#8080a0",
                hiliteLine="#000000", hiliteFill="#408000",
                normalLine="#404040", normalFill="#a0a0a0",
                points=None):
    srcType = datasource['type']
    del datasource['type']

    if srcType == "OGR":
        source = mapnik.Ogr(**datasource)
    elif srcType == "PostGIS":
        source = mapnik.PostGIS(**datasource)
    elif srcType == "SQLite":
        source = mapnik.SQLite(**datasource)

    layer = mapnik.Layer("Layer")
    layer.datasource = source

    map = mapnik.Map(mapWidth, mapHeight,
                     '+proj=longlat +datum=WGS84')
    map.background = mapnik.Color(background)

    style = mapnik.Style()

    rule = mapnik.Rule()
    if hiliteExpr != None:
        rule.filter = mapnik.Filter(hiliteExpr)

    rule.symbols.append(mapnik.PolygonSymbolizer(
        mapnik.Color(hiliteFill)))
    rule.symbols.append(mapnik.LineSymbolizer(
        mapnik.Stroke(mapnik.Color(hiliteLine), 0.1)))

    style.rules.append(rule)

    rule = mapnik.Rule()
    rule.set_else(True)

    rule.symbols.append(mapnik.PolygonSymbolizer(
        mapnik.Color(normalFill)))
    rule.symbols.append(mapnik.LineSymbolizer(
        mapnik.Stroke(mapnik.Color(normalLine), 0.1)))

    style.rules.append(rule)

    map.append_style("Map Style", style)
    layer.styles.append("Map Style")
    map.layers.append(layer)

    if points != None:
        pointDatasource = mapnik.PointDatasource()
        for long,lat,name in points:
            pointDatasource.add_point(long, lat, "name", name)

        layer = mapnik.Layer("Points")
        layer.datasource = pointDatasource

        style = mapnik.Style()
        rule = mapnik.Rule()

        pointImgFile = os.path.join(os.path.dirname(__file__),
                                    "point.png")

        shield = mapnik.ShieldSymbolizer(
                   "name", "DejaVu Sans Bold", 10,
                    mapnik.Color("#000000"),
                    pointImgFile, "png", 9, 9)
        shield.displacement(0, 7)
        shield.unlock_image = True
        rule.symbols.append(shield)

        style.rules.append(rule)

        map.append_style("Point Style", style)
        layer.styles.append("Point Style")

        map.layers.append(layer)

    map.zoom_to_box(mapnik.Envelope(minX, minY, maxX, maxY))

    scriptDir = os.path.dirname(__file__)
    cacheDir = os.path.join(scriptDir, "..", "mapCache")
    if not os.path.exists(cacheDir):
        os.mkdir(cacheDir)
    fd,filename = tempfile.mkstemp(".png", dir=cacheDir)
    os.close(fd)

    mapnik.render_to_file(map, filename, "png")

    return "../mapCache/" + os.path.basename(filename)
Tip
We won't be explaining how this module works here. For more information on Mapnik, please refer to Chapter 8, Using Python and Mapnik to Generate Maps.
Before you can run this CGI script, you need to have Mapnik installed. The Mapnik toolkit can be found at: http://mapnik.org
If you are running Mac OS X and don't wish to compile Mapnik yourself from source, a pre-built version can be downloaded from: http://dbsgeo.com/downloads
You will also need to have a small image file, named point.png, which is used to mark placenames on the map. This 9 x 9 pixel image looks like this:
Place this file into the same directory as the mapGenerator.py module itself.
The final CGI script is where all the work is done. We take the (x,y) coordinate the user clicked on, along with the entered search radius, convert the (x,y) coordinate into a longitude and latitude, and identify all the placenames within the specified search radius. We then generate a high-resolution map showing the shorelines and placenames within the search radius, and display that map to the user.
Let's examine each of these steps in turn.
The selectArea.py script generated an HTML form that was submitted when the user clicked on the low-resolution country map. The showResults.py script then receives the form parameters, including the x and y coordinates of the point the user clicked on.
By itself, this coordinate isn't very useful as it is the pixel coordinate within the map image. We need to translate the submitted (x,y) pixel coordinate into a latitude and longitude value corresponding to the clicked-on point on the Earth's surface.
To do this, we need to have the following information:
- The map's bounding box in geographic coordinates:
minLong, minLat, maxLong, andmaxLat - The map's size in pixels:
mapWidthandmapHeight
These variables were all calculated in the previous section and passed to us using hidden form variables, along with the country ID, the desired search radius, and the (x,y) coordinate of the clicked-on point. We can retrieve all of these using the cgi module:
import cgi

form = cgi.FieldStorage()

countryID = int(form['countryID'].value)
radius    = int(form['radius'].value)
x         = int(form['x'].value)
y         = int(form['y'].value)
mapWidth  = int(form['mapWidth'].value)
mapHeight = int(form['mapHeight'].value)
With this information, we can now calculate the latitude and longitude that the user clicked on. To do this, we first calculate how far across the image the user clicked, as a number in the range 0..1:
xFract = float(x)/float(mapWidth)
An xFract value of 0.0 corresponds to the left side of the image, while an xFract value of 1.0 corresponds to the right side of the image. We then combine this with the minimum and maximum longitude values to calculate the longitude of the clicked-on point:
longitude = minLong + xFract * (maxLong-minLong)
We then do the same to convert the Y coordinate into a latitude value:
yFract = float(y)/float(mapHeight)
latitude = minLat + (1-yFract) * (maxLat-minLat)
Note that we are using (1-yFract) rather than yFract in the above calculation. This is because the minLat value refers to the latitude of the bottom of the image, while a yFract value of 0.0 corresponds to the top of the image. By using (1-yFract), we flip the values vertically so that the latitude is calculated correctly.
Let's review what we have achieved so far. The user has selected a country, viewed a simple map of the country's outline, entered a desired search radius, and clicked on a point on the map to identify the origin for the search. We have then converted this clicked-on point to a latitude and longitude value.
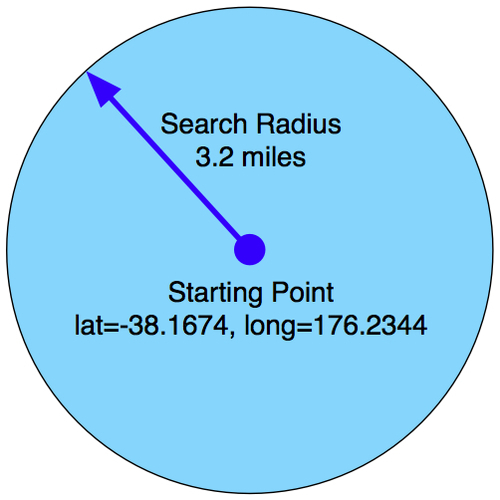
All of this provides us with three numbers: the desired search radius, and the lat/long coordinates for the point at which to start the search. Our task now is to identify which features are within the given search radius of the clicked-on point:
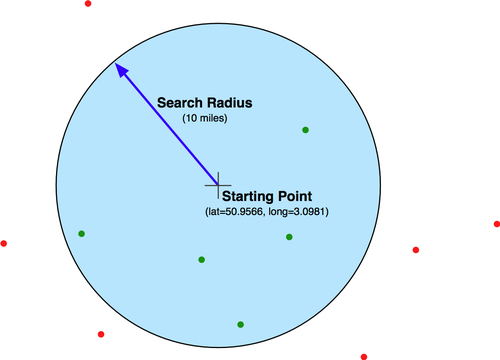
Because the search radius is specified as an actual distance in miles, we need to be able to calculate distances accurately. We looked at an approach to solving this problem in Chapter 2, GIS where we considered the concept of a Great Circle Distance:
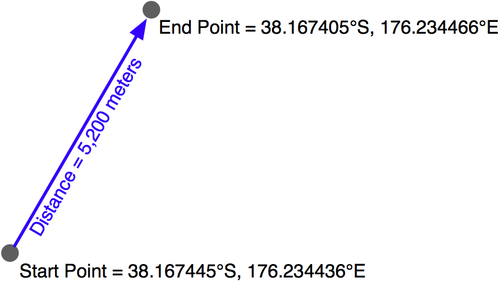
Given a start and end point, the great circle distance calculation tells us the distance along the Earth's surface between the two points.
In order to identify the matching features, we need to somehow find all the matching placenames that have a great circle distance less than or equal to the desired search radius. Let's look at some ways in which we could possibly identify these features.
As we saw in Chapter 5, Working with Geo-Spatial Data in Python
pyproj allows us to do accurate great circle distance calculations based on two lat/long coordinates, like this:
geod = pyproj.Geod(ellps='WGS84')
angle1,angle2,distance = geod.inv(long1, lat1,
                                  long2, lat2)
The resulting distance is in meters, and we could easily convert this to miles as follows:
miles = distance / 1609.344
Based on this, we could write a simple program to find the features within the desired search radius:
geod = pyproj.Geod(ellps="WGS84")

cursor.execute("select id,X(position),Y(position) " +
               "from places")
for id,long,lat in cursor:
    angle1,angle2,distance = geod.inv(startLong, startLat,
                                      long, lat)
    if distance / 1609.344 <= searchRadius:
        ...
A program like this would certainly work, and would return an accurate list of all features within the given search radius. The problem is one of speed: because there are more than four million features in our places table, this program would take several minutes to identify all the matching placenames. Obviously, this isn't a very practical solution.
We saw an alternative way of identifying features by distance in Chapter 5, Working with Geo-Spatial Data in Python where we looked for all parks in or near an urban area. In that chapter, we used an angular distance to estimate how far apart two points were. An angular distance is a distance measured in degrees—technically, it is the angle between two rays going out from the center of the Earth through the two desired points on the Earth's surface. Because latitude and longitude values are angular measurements, we can easily calculate an angular distance based on two lat/long values, like this:
distance = math.sqrt((long2-long1)**2) + (lat2-lat1)**2)
This is a simple Cartesian distance calculation. We are naïvely treating lat/long values as if they were Cartesian coordinates. This isn't right, but it does give us a distance measurement of sorts.
So, what does this angular distance measurement give us? We know that the bigger the angular distance, the bigger the real (great circle) distance will be. In Chapter 5, Working with Geo-Spatial Data in Python we used this to identify all parks in California that where approximately within 10 kilometers of an urban area. However, we could get away with this in Chapter 5 because we were only dealing with data for California. In reality, the angular distance varies greatly depending on which latitude you are dealing with; looking for points within ±1 degree of longitude of your current location will include all points within 111 km if you are at the equator, 100 km if you are at ±30° latitude, 55 km at ±60°, and zero km at the poles:
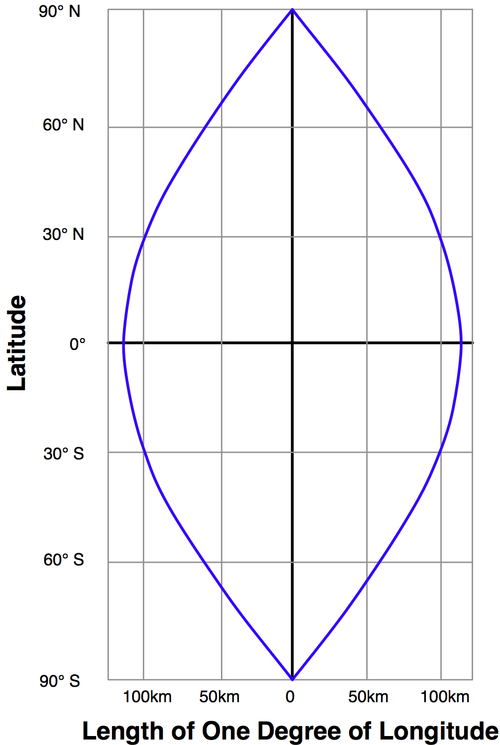
Because DISTAL includes data for the entire world, angular measurements would be all but useless—we can't assume that a given difference in latitude and longitude values would equal a given distance across the Earth's surface in any way that would help us do distance-based searching.
Another way of finding all points within a given distance is to use a projected coordinate system that accurately represents distance as differences between coordinate values. For example, the Universal Transverse Mercator projection defines Y coordinates as a number of meters north or south of the equator, and X coordinates as a number of meters east or west of a given reference point. Using the UTM projection, it would be easy to identify all points within a given distance by using the Cartesian distance formula:
distance = math.sqrt((long2-long1)**2) + (lat2-lat1)**2)
if distance < searchRadius:
    ...
Unfortunately, projected coordinate systems such as UTM are only accurate for data that covers a small portion of the Earth's surface. The UTM coordinate system is actually a large number of different projections, dividing the world up into 60 separate "zones", each six degrees of longitude wide. You need to use the correct UTM zone for your particular data: California's coordinates belong in UTM zone 10, and attempting to project them into UTM zone 20 would cause your distance measurements to be very inaccurate.
If you had data that covered only a small area of the Earth's surface, using a projected coordinate system would have great advantages. Not only could you calculate distances using Cartesian coordinates, you could also make use of database functions such as PostGIS' ST_DWithin() function to quickly find all points within a given physical distance of a central point.
Unfortunately, the DISTAL application makes use of data covering the entire Earth. For this reason, we can't use projected coordinates for this application, and have to find some other way of solving this problem.
Note
Of course, the DISTAL application was deliberately designed to include worldwide data, for precisely this reason. Being able to use a single UTM zone for all the data would be too convenient.
Actually, there is a way in which DISTAL could use projected UTM coordinates, but it's rather complicated. Because every feature in a given database table has to have the same spatial reference, it isn't possible to have different features in a table belonging to different UTM zones—the only way we could store worldwide data in UTM projections would be to have a separate database table for each UTM zone. This would require 60 separate database tables! To identify the points within a given distance, you would first have to figure out which UTM zone the starting point was in, and then check the features within that database table. You would also have to deal with searches that extend out beyond the edge of a single UTM zone.
Needless to say, this approach is far too complex for us. It would work (and would scale better than any of the alternatives), but we won't consider it because of its complexity.
In the previous chapter, we looked at the process of identifying all points within a given polygon. Because MySQL only handles bounding box intersection tests, we ended up having to write a program that asked the database to identify all points within the bounding box, and then manually checked each point to see if it was actually inside the polygon:
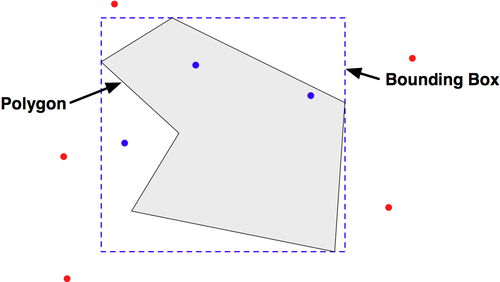
This suggests a way we can solve the distance-based selection problem for DISTAL: we calculate a bounding box that encloses the desired search radius, ask the database to identify all points within that bounding box, and then calculate the great circle distance for all the returned points, selecting just those points that are actually inside the search radius. Because a relatively small number of points will be inside the bounding box, calculating the great circle distance for just these points will be quick, allowing us to accurately find the matching points without a large performance penalty.
Let's start by calculating the bounding box. We already know the coordinates for the starting point and the desired search radius:
Using pyproj, we can calculate the lat/long coordinates for four points by traveling radius meters directly north, south, east, and west of the starting point:
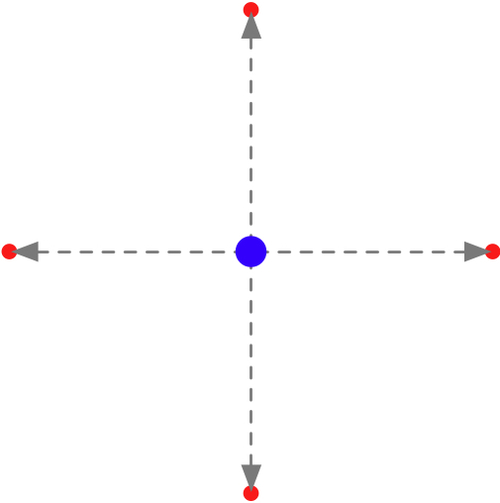
We then use these four points to define the bounding box that encloses the desired search radius:
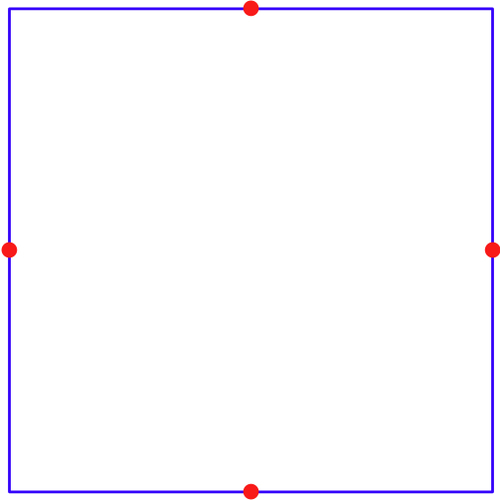
Here's a Python function to calculate this bounding box:
import pyproj

def calcSearchBounds(startLat, startLong, searchRadius):
    geod = pyproj.Geod(ellps="WGS84")

    x,y,angle = geod.fwd(startLong, startLat, 0,
                         searchRadius)
    maxLat = y

    x,y,angle = geod.fwd(startLong, startLat, 90,
                         searchRadius)
    maxLong = x

    x,y,angle = geod.fwd(startLong, startLat, 180,
                         searchRadius)
    minLat = y

    x,y,angle = geod.fwd(startLong, startLat, 270,
                         searchRadius)
    minLong = x

    return (minLong, minLat, maxLong, maxLat)
Note that, because we're using pyproj to do a forward geodetic calculation, this will return the correct lat/long coordinates for the bounding box regardless of the latitude of the starting point. The only place this will fail is if startLat is within searchRadius meters of the North or South Pole—which is highly unlikely given that we're searching for cities (and we could always add error-checking code to catch this).
Given this function, we can easily create a Polygon containing the bounding box, and use the database to find all features within that bounding box. First, we create the Polygon and convert it to WKT format:
from shapely.geometry import Polygon
import shapely.wkt

p = Polygon([(minLong, minLat), (maxLong, minLat),
             (maxLong, maxLat), (minLong, maxLat),
             (minLong, minLat)])
wkt = shapely.wkt.dumps(p)
We can then pass this to the database to find all points within the bounding box, using a spatial join. We haven't looked at the concept of spatial joins yet, so let's do that now.
If you have worked with databases in the past, you're probably already familiar with the concept of a join operation, where you combine information from two or more linked database tables. A traditional database join links tables together using field values, for example by storing the primary key of one record in a second table:
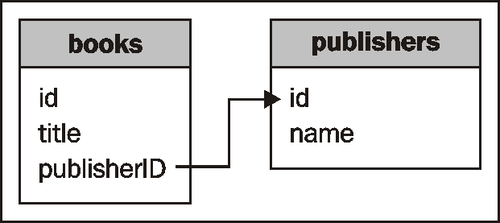
You can then join the tables together like this:
SELECT books.title,publisher.name FROM books,publishers
 WHERE books.publisherID = publishers.id;
A spatial join works in the same way, except that you connect the records using spatial predicates like MBRIntersects(), ST_Contains(), or ST_DWithin(). These predicates identify records that are related in some way spatially, for example by having overlapping bounding boxes or being within a given distance of each other.
In this case, we want to use a spatial join to identify all the places within the calculated lat/long bounding box. To do this using MySQL, we would write the following:
connection = MySQLdb.connect(user="...", passwd="...")
cursor = connection.cursor()

cursor.execute("USE distal")

cursor.execute("SELECT id,name,X(position),Y(position) " +
					"FROM places WHERE MBRContains(" +
               "GeomFromText(%s), position)", (wkt,))
for row in cursor:
    ...
Using PostGIS:
connection = psycopg2.connect("dbname=... user=...")
cursor = connection.cursor()
cursor.execute("SET NAMES 'utf8'")

cursor.execute("SELECT id,name,X(position),Y(position) " +
               "FROM places WHERE ST_Contains(" +
               "GeomFromText(%s, 4326), position)", (wkt,))
 for row in cursor:
    ...
Remember that SpatiaLite doesn't automatically use a spatial index for queries. To make this code efficient in SpatiaLite, we have to check the spatial index directly:
db = sqlite.connect("distal.db")
db.enable_load_extension(True)
db.execute('SELECT load_extension("...")')
cursor = db.cursor()

cursor.execute("SELECT id,name,X(position),Y(position) " +
               "FROM places WHERE id in (SELECT pkid " +
               "FROM idx_places_position " +
               "WHERE xmin >= ? AND xmax <= ? " +
               "AND ymin >= ? and ymax <= ?)",
               (minLong, maxLong, minLat, maxLat))
for row in cursor:
    ...
Obviously, spatial joins work best if the database includes spatial indexes that can be used to join together the two tables. One of the challenges of developing spatial queries is to make sure that the database can and does use your spatial indexes; using the techniques described in the previous chapter, you can analyze your queries, and modify them if necessary, to ensure that your spatial indexes are used.
Now that we have identified all the points within the bounding box, we can check the Great Circle distance and discard those points that are inside the bounding box, but outside the search radius:
...

geod = pyproj.Geod(ellps="WGS84")

for row in cursor:
    id,name,long,lat = row
    angle1,angle2,distance = geod.inv(startLong, startLat,
                                      long, lat)
    if distance > searchRadius: continue

    ...
Using this logic, we can achieve a 100 percent accurate distance-based lookup on placenames, with the results taking only a fraction of a second to calculate.
Now that we have calculated the list of placenames within the desired search radius, we can use the mapGenerator.py module to display them. To do this, we first set up a list of all the matching placenames:
placenames = [] # List of (long, lat, name) tuples.

for row in cursor:
    id,name,long,lat = row
    angle1,angle2,distance = geod.inv(startLong, startLat,
                                      long, lat)
    if distance > searchRadius: continue

    placenames.append([long, lat, name])
We then set up our datasource to access the shorelines table. For MySQL, we set up a shorelines.vrt file like this:
<OGRVRTDataSource>
  <OGRVRTLayer name="shorelines">
    <SrcDataSource>MYSQL:distal,user=USER,passwd=PASS,
        tables=shorelines</SrcDataSource>
    <SrcSQL>
      SELECT id,outline FROM shorelines where level=1
   </SrcSQL>
  </OGRVRTLayer>
</OGRVRTDataSource>
and then define our datasource dictionary as follows:
vrtFile = os.path.join(os.path.dirname(__file__),
                       "shorelines.vrt")

datasource = {'type'  : "OGR",
              'file'  : vrtFile,
              'layer' : "shorelines"}
Note
Notice that the SrcSQL statement in our .VRT file only includes shoreline data where level = 1. This means that we’re only displaying the coastlines, and not the lakes, islands-on-lakes, and so on. Because the mapGenerator.py module doesn’t support multiple datasources, we aren’t able to draw lakes in this version of the DISTAL system. Extending mapGenerator.py to support multiple datasources is possible, but is too complicated for this chapter. For now we’ll just have to live with this limitation
Using PostGIS, we set up the datasource dictionary like this:
datasource = {'type'     : "PostGIS",
              'dbname'   : "distal",
              'table'    : "shorelines",
              'user'     : "...",
              'password' : "..."}
And for SpatiaLite, we use the following code:
dbFile = os.path.join(os.path.dirname(__file__),
                      "distal.db")

datasource = {'type'           : "SQLite",
              'file'           : dbFile,
              'table'          : "shorelines",
              'geometry_field' : "outline",
              'key_field'      : "id"}
We can then call mapGenerator.generateMap to generate an image file containing the map:
imgFile = mapGenerator.generateMap(datasource,
                                   minLong, minLat,
                                   maxLong, maxLat,
                                   mapWidth, mapHeight,
                                   points=placenames)
When we called the map generator previously, we used a filter expression to highlight particular features. In this case, we don't need to highlight anything. Instead, we pass it the list of placenames to display on the map in the keyword parameter named points.
The map generator creates a PNG-format file, and returns a reference to that file that we can then display to the user:
print 'Content-Type: text/html; charset=UTF-8

'
print '<html>'
print '<head><title>Search Results</title></head>'
print '<body>"
print '<b>' + countryName + '</b>'
print '<p>'
print '<img src="' + imgFile + '">'
print '</body>'
print '</html>'
This completes our first version of the showResults.py CGI script.