
It's very hard, if not impossible, to understand geo-spatial data unless it is turned into a visual form—that is, until it is rendered as an image of some sort. Converting geo-spatial data into images requires a suitable toolkit. While there are several such toolkits available, we will look at one in particular: Mapnik.
Mapnik is a freely-available toolkit for building mapping applications. Mapnik takes geo-spatial data from a PostGIS database, Shapefile, or any other format supported by GDAL/OGR, and turns it into clearly-rendered, good-looking images.
There are a lot of complex issues involved in rendering images well, and Mapnik does a good job of allowing the application developer to control the rendering process. Rules control which features should appear on the map, while Symbolizers control the visual appearance of these features.
Mapnik allows developers to create XML stylesheets that control the map-creation process. Just as with CSS stylesheets, Mapnik's stylesheets give you complete control over the way geo-spatial data is rendered. Alternatively, you can create your styles by hand if you prefer.
Mapnik itself is written in C++, though bindings are included that allow access to almost all of the Mapnik functionality via Python. Because these bindings are included in the main code base rather than being added by a third-party developer, support for Python is built right into Mapnik. This makes Python eminently suited to developing Mapnik-based applications.
Mapnik is heavily used by Open Street Map (http://openstreetmap.org) and EveryBlock (http://everyblock.com) among others. Since the output of Mapnik is simply an image, it is easy to include Mapnik as part of a web-based application, or you can display the output directly in a window as part of a desktop-based application. Mapnik works equally well on the desktop and on the web.
When using Mapnik, the main object you are dealing with is called the Map. A Map object has the following parts:
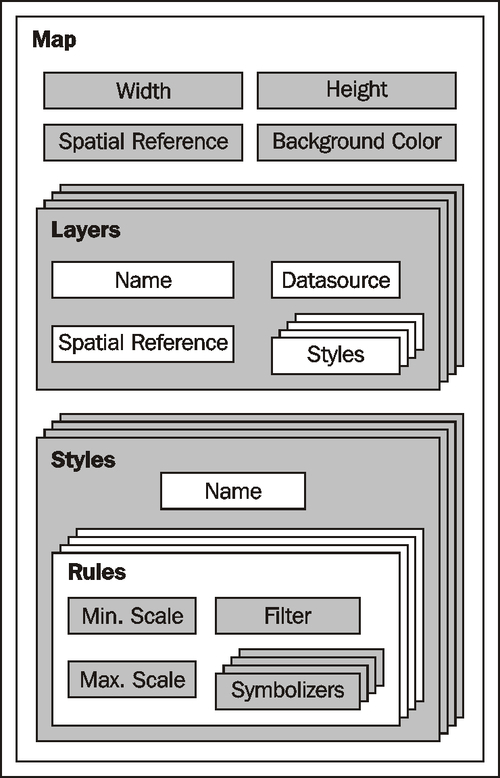
When creating a Map object, you tell it:
- The overall width and height of the map, in pixels.
- The spatial reference to use for the map.
- The background color to draw behind the contents of the map.
You then define one or more Layers that hold the map's contents. Each Layer has:
- A name.
- A Datasource object defining where to get the data for this layer from. The datasource can be a reference to a database, or it can be a Shapefile or other GDAL/OGR datasource.
- A spatial reference to use for this layer. This can be different from the spatial reference used by the map as a whole, if appropriate.
- A list of styles to apply to this layer. Each style is referred to by name, since the styles are actually defined elsewhere (often in an XML stylesheet).
Finally, you define one or more Styles that tell Mapnik how to draw the various layers. Each Style has a name and a list of Rules that make up the main part of the style's definition. Each Rule has:
- A minimum scale and maximum scale value (called the "scale denominator"). The Rule will only apply if the map's scale is within this range.
- A filter expression. The Rule will only apply to those features that match this filter expression.
- A list of Symbolizers. These define how the matching features will be drawn onto the map.
There are a number of different types of Symbolizers implemented by Mapnik:
LineSymbolizeris used to draw a "stroke" along a line, a linear ring, or around the outside of a polygon.LinePatternSymbolizeruses the contents of an image file (specified by name) to draw the "stroke" along a line, a linear ring, or around the outside of a polygon.PolygonSymbolizeris used to draw the interior of a polygon.PolygonPatternSymbolizeruses the contents of an image file (again specified by name) to draw the interior of a polygon.PointSymbolizeruses the contents of an image file (specified by name) to draw a symbol at a point.TextSymbolizerdraws a feature's text. The text to be drawn is taken from one of the feature's attributes, and there are numerous options to control how the text is to be drawn.RasterSymbolizeris used to draw raster data taken from any GDAL dataset.ShieldSymbolizerdraws a textual label and a point together. This is similar to the use of a PointSymbolizer to draw the image and a TextSymbolizer to draw the label, except that it ensures that both the text and the image are drawn together.BuildingSymbolizeruses a pseudo-3D effect to draw a polygon, to make it appear that the polygon is a three-dimensional building.- Finally,
MarkersSymbolizerdraws blue directional arrows following the direction of polygon and line geometries. This is experimental, and is intended to be used to draw one-way streets onto a street map.
When you instantiate a Symbolizer and add it to a style (either directly in code, or via an XML stylesheet), you provide a number of parameters that define how the Symbolizer should work. For example, when using the PolygonSymbolizer, you can specify the fill color, the opacity, and a "gamma" value that helps draw adjacent polygons of the same color without the boundary being shown:
p = mapnik.PolygonSymbolizer(mapnik.Color(127, 127, 0))
p.fill_opacity = 0.8
p.gamma = 0.65
If the Rule that uses this Symbolizer matches one or more polygons, those polygons will be drawn using the given color, opacity, and gamma value.
Different Rules can, of course, have different Symbolizers, as well as different filter values. For example, you might set up Rules that draw countries in different colors depending on their population.
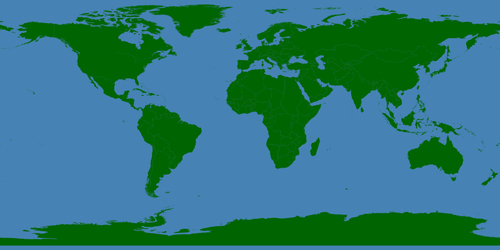
The following example program displays a simple world map using Mapnik:
import mapnik

symbolizer = mapnik.PolygonSymbolizer(
mapnik.Color("darkgreen"))

rule = mapnik.Rule()
rule.symbols.append(symbolizer)

style = mapnik.Style()
style.rules.append(rule)

layer = mapnik.Layer("mapLayer")
layer.datasource = mapnik.Shapefile(
file="TM_WORLD_BORDERS-0.3.shp")
layer.styles.append("mapStyle")

map = mapnik.Map(800, 400)
map.background = mapnik.Color("steelblue")
map.append_style("mapStyle", style)
map.layers.append(layer)

map.zoom_all()
mapnik.render_to_file(map, "map.png", "png")
Notice that this program creates a PolygonSymbolizer to display the country polygons, and then attaches the symbolizer to a Mapnik Rule object. The Rule then becomes part of a Mapnik Style object. We then create a Mapnik Layer object, reading the layer's map data from a Shapefile datasource. Finally, a Mapnik Map object is created, the layer is attached, and the resulting map is rendered to a PNG-format image file:
Mapnik's documentation is about average for an open source project—good installation guides and some excellent tutorials, but with rather confusing API documentation. The Python documentation is derived from the C++ documentation. It concentrates on describing how the Python bindings are implemented rather than how an end user would work with Mapnik using Python. There are a lot of technical details that aren't relevant to the Python programmer and not enough Python-specific descriptions to be all that useful, unfortunately.
The best way to get started with Mapnik is to follow the installation instructions, and then to work your way through the two supplied tutorials. You can then check out the Learning Mapnik page on the Mapnik wiki (http://trac.mapnik.org/wiki/LearningMapnik). The notes on these pages are rather brief and cryptic, but there is useful information here if you're willing to dig.
It is worth looking at the Python API documentation, despite its limitations. The main page lists the various classes that are available and a number of useful functions, many of which are documented. The classes themselves list the methods and properties (attributes) you can access, and even though many of these lack Python-specific documentation, you can generally guess what they do.
Chapter 8 includes a comprehensive description of Mapnik; you may find this useful in lieu of any other Python-based documentation.
Mapnik runs on all major operating systems, including MS Windows, Mac OS X, and Linux. The main Mapnik website can be found at:
Download links are provided for downloading the Mapnik source code, which can be readily compiled if you are running on a Unix machine, and you can also download pre-built binaries for Windows computers. For those running Mac OS X, pre-built binaries are available at:
Make sure that you install Mapnik version 1.7.1 or later; you will need to use this version as you work through the examples in this book.