
Because geo-spatial data is almost impossible to understand until it is displayed, the creation of maps to visually represent spatial data is an extremely important topic. In this chapter, we will look at Mapnik, a powerful Python library for generating maps out of geo-spatial data.
This chapter will cover:
- The underlying concepts used by Mapnik to generate maps
- How to create a simple map using the contents of a Shapefile
- The different datasources that Mapnik support
- How to use rules, filters, and styles to control the map-generation process
- How to use symbolizers to draw lines, polygons, labels, points, and raster images onto your map
- How to define the colors used on a map
- How to work with maps and layers
- Your options for rendering a map image
- How the
mapGenerator.pymodule, introduced in the previous chapter, uses Mapnik to generate maps - Using map definition files to control and simplify the map-generation process
Mapnik is a powerful toolkit for using geo-spatial data to create maps. Mapnik can be downloaded from:
Mapnik is a complex library with many different parts, and it is easy to get confused by the various names and concepts. Let's start our exploration of Mapnik by looking at a simple map:
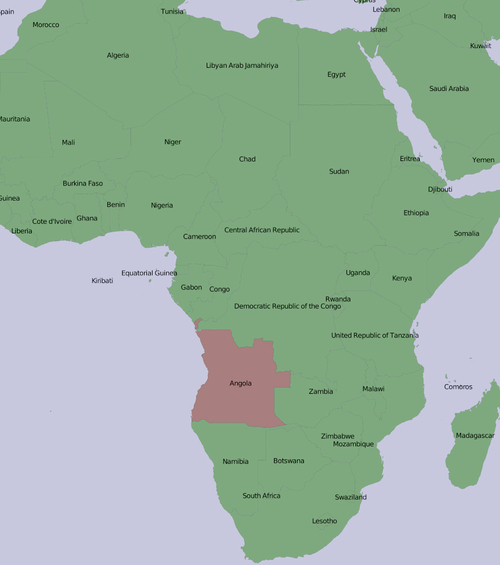
One thing that may not be immediately obvious is that the various elements within the map are layered:
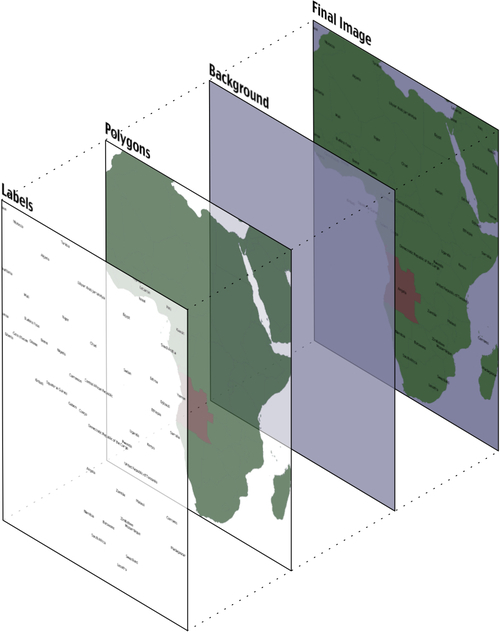
To generate this map, you have to tell Mapnik to initially draw the background, then the polygons, and finally the labels. This ensures that the polygons sit on top of the background, and the labels appear in front of both the polygons and the background.
Note
Strictly speaking, the background isn't a layer. It's simply a color that Mapnik uses to fill in the map before it starts drawing the first layer.
Mapnik allows you to control the order in which the map elements are drawn through the use of Layer objects. A simple map may consist of just one layer, but most maps have multiple layers. The layers are drawn in a strict back-to-front order, so the first layer you define will appear at the back. In the above example, the Polygons layer would be defined first, followed by the Labels layer, to ensure that the labels appear in front of the polygons. This layering approach is called the painter's algorithm because of its similarity to placing layers of paint onto an artist's canvas.
Each Layer has its own Datasource, which tells Mapnik where to load the data from. A Datasource can refer to a Shapefile, a spatial database, a raster image file, or any number of other geo-spatial datasources. In most cases, setting up a Layer's datasource is very easy.
Within each Layer, the visual display of the geo-spatial data is controlled through something called a symbolizer. While there are many different types of symbolizers available within Mapnik, three symbolizers are of interest to us here:
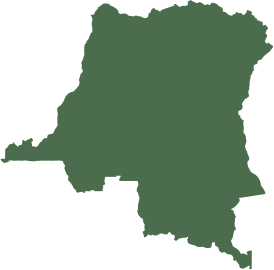
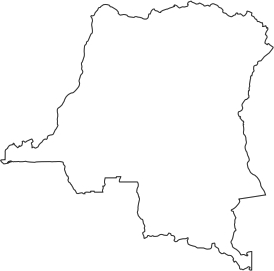
In many cases, these three symbolizers are enough to draw an entire map. Indeed, almost all of the above example map was produced using just one PolygonSymbolizer, one LineSymbolizer, and one TextSymbolizer:
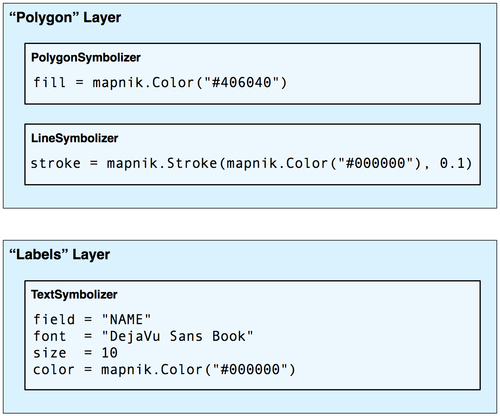
The symbolizers aren't associated directly with a layer. Rather, there is an indirect association of symbolizers with a layer through the use of styles and rules. We'll look at styles in a minute, but for now let's take a closer look at the concept of a Mapnik Rule.
A rule allows a set of symbolizers to apply only when a given condition is met. For example, the map at the start of this chapter displayed Angola in brown, while the other countries were displayed in green. This was done by defining two rules within the Polygons layer:
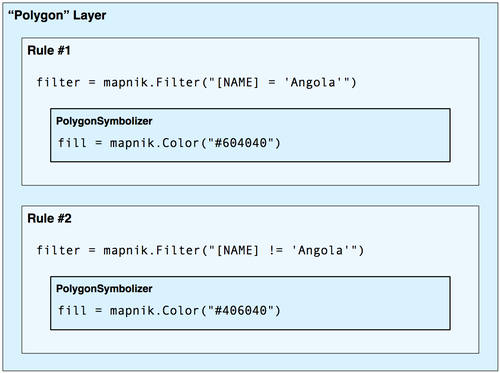
The first rule has a filter that only applies to features that have a NAME attribute equal to the string Angola. For features that match this Filter condition, the rule's PolygonSymbolizer will be used to draw the feature in dark red.
The second rule has a similar filter, this time checking for features that don't have a NAME attribute equal to Angola. These features are drawn using the second rule's PolygonSymbolizer, which draws the features in dark green.
Obviously, rules can be very powerful in selectively changing the way features are displayed on a map. We'll be looking at rules in much more detail in the Rules, filters, and styles section of this chapter.
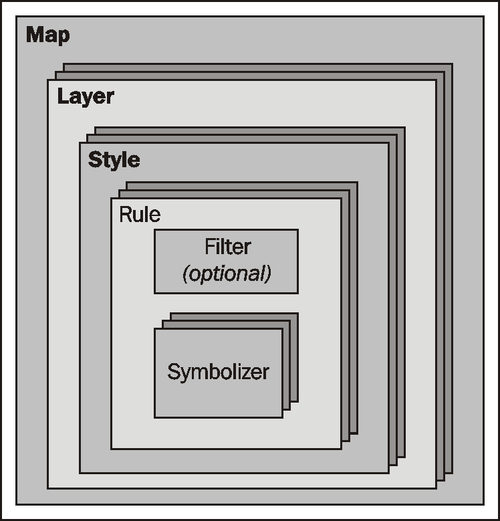
When you define your symbolizers, you place them into rules. The rules themselves are grouped into styles, which can be used to organize and keep track of your various rules. Each map layer itself has a list of the styles that apply to that particular layer.
While this complex relationship between layers, styles, rules, and symbolizers can be confusing, it also provides much of Mapnik's power and flexibility, and it is important that you understand how these various classes work together:
Finally, instead of using Python code to create the various Mapnik objects by hand, you can choose to use a Map Definition File. This is an XML-format file that defines all the symbolizers, filters, rules, styles, and layers within a map. Your Python code then simply creates a new mapnik.Map object and tells Mapnik to load the map's contents from the XML definition file. This allows you to define the contents of your map separately from the Python code that does the map generation in much the same way as an HTML templating engine separates form and content within a web application.