CHAPTER 22
Using Healthcare IT to Measure and Improve Healthcare Quality and Outcomes
Floyd P. Eisenberg
In this chapter, you will learn how to
• Understand the structure and components of a quality measure to help implement the components in electronic health records (EHRs)
• Determine whether there is sufficient precision in a quality measure definition to implement it in an EHR and obtain consistent results
• Consider clinical workflow to capture and manage data in an EHR for use in clinical decision support or quality measure reporting
• Identify evolving standards used for electronic quality measurement
Why Measure Quality?
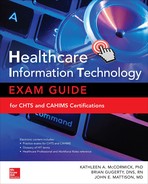
“If you cannot measure it, you cannot control it. If you cannot control it, you cannot manage it. If you cannot manage it, you cannot improve it.”1 But while the concept of measurement is not new,2 the method to apply measurement to health and healthcare has evolved over the past few decades through work by many organizations (Table 22-1).
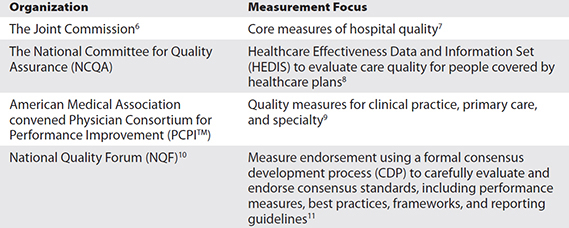
Table 22-1 Some Quality Measurement Organizations
Though a goal of measurement is to help increase the consistency with which basic healthcare is delivered, studies have shown that care provided by different organizations or providers is not the same.3, 4, 5 Many have turned to measurement to provide the forcing function to standardize and consistently apply care processes that evidence strongly suggests will improve patients’ health. Using consensus standards will improve the ability to evaluate and compare the quality of care provided. That is why many government programs use NQF-endorsed measures to evaluate their network of providers. NQF is a not-for-profit, membership-based organization that works to increase healthcare value, make patient care safer, and achieve better outcomes. Among other things, NQF is a consensus–standards setting organization for healthcare quality. As such, NQF helps healthcare quality measure developers—which are often healthcare professional societies/organizations like the American Medical Association (AMA) and the American Nurses Association (ANA)—create feasibly measurable, broad-based, and impactful measures of healthcare quality. Actually, anyone or any organization defining how to quantify healthcare performance and outcomes is a measure developer. NQF provides the rigorous consensus process to substantiate that measures it endorses are impactful, reliable, valid, feasible, and useful. In the next section, we’ll jump right into some considerations that healthcare quality developers might have when they are working to develop healthcare quality measures that come from clinicians’ normal daily use of electronic health records (EHRs). We’ll then use that practical foundation in exploring other aspects of healthcare electronic quality measurement.
Defining Quality Measures for EHR Queries
Let’s get started by going through two example measures to explain the kind of detail needed to ask a question of an EHR. The EHR is primarily a database. It will provide data only if you ask in a way it can understand. And if the question is somewhat ambiguous, so will be the answer, if an answer is possible at all. To start, refer to Table 22-2 for a list of measure components.
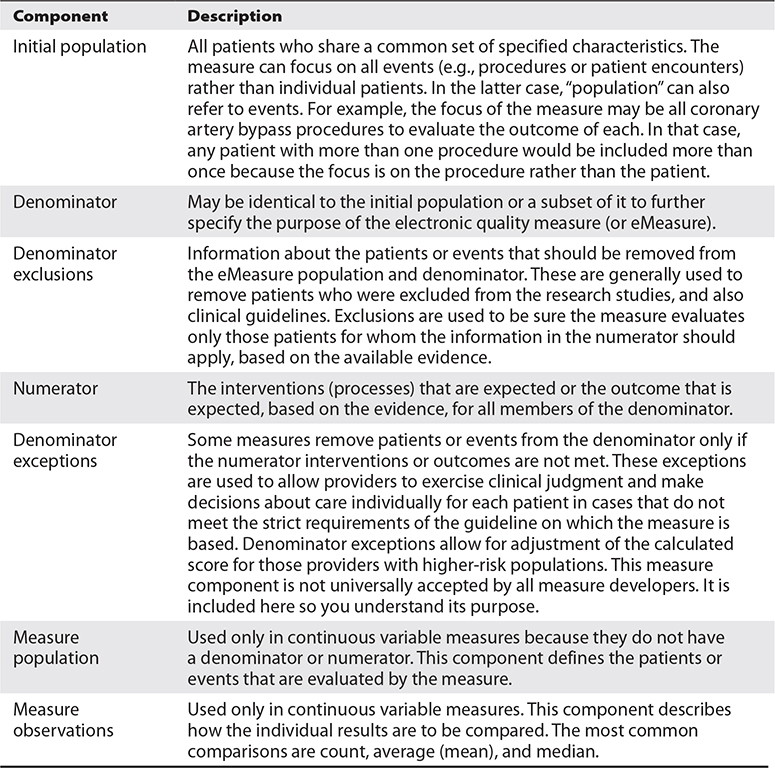
Table 22-2 Quality Measure Structure
While we walked through some basic information about patients and how to specify the measure, it is important to note that some information needed may be stored outside the EHR in the form needed. One example is a cancer (oncology) diagnosis that includes staging criteria. The laboratory pathology database may contain structured information about the diagnosis, the number of lymph nodes, and the known location of metastases (where the cancer has spread), each in separate fields. However, that information is often present in a narrative text report (or as an image in a PDF format) in an EHR database and, therefore, such details may be difficult to extract directly from the EHR. Another example is a cardiac left ventricular ejection fraction, a measurement of the amount of blood pumped out of the left ventricle with each contraction of the heart. A cardiac catheterization laboratory database or the radiology department’s cardiac ultrasound database may store such information in discrete, structured fields. However, the report stored in the EHR may present the information in a narrative text report or as an image in PDF format, limiting the ability to extract the information directly. Measure developers need to evaluate the preferred sources of data and assure they are available in determining the feasibility of their measures.
Use Case 22-1: Defining a Quality Measure, Example 1
Request: Identify all children with normal blood pressure.
Let’s assume we are working for the measure developer in this case. We need to break down the question into its component parts to be sure the EHR provides the right information to calculate the result. The first question is, “What is the time period of interest?” To clarify, we can state this:
Population: All children seen during the calendar year 2016.
Now the time period is clear, but we need to be specific about which children—all of those living in the city, all of those insured by a local health plan, or all of those seen at least twice in the office practice. We will choose the last group because it is something the EHR can find for us.
Population: All children seen in the office at least twice during the calendar year 2016.
Getting a bit deeper in the review, we find that the EHR doesn’t identify people as “children” or “not children.” So, we need to define what we mean by the term. We generally want to use a common definition, so we will add the following:
Population: All people who are 18 or younger as of the day prior to the calendar year 2016 and who are seen in the office at least twice during the same year.
Now we are pretty sure we know those of interest to the measure. This population is our denominator; the group we will evaluate. But now we find that providers don’t record blood pressure as “normal blood pressure” or “abnormal blood pressure.” Rather, they measure and record every blood pressure as two values: the systolic (the pressure when the heart is beating) and the diastolic (the pressure when the heart is resting between beats). An example of a blood pressure reading, measured in millimeters of mercury (mmHg), would be recorded as 118/74; the first, higher number is the systolic reading, and the second, lower number is the diastolic reading. So, now it is important to define what level of blood pressure is considered “normal.” We were asked to create the measure because there is a set of charts available based on evidence that the National Heart, Lung, and Blood Institute (NHLBI) published to define what is “normal.”12

TIP Reliable sources of evidence are those produced by government agencies and specialty organizations.
Using those charts, a provider can compare any given child’s height, sex, and age to find how that child compares to other children in the United States. The result is a percentile rank. Children in the ninety-fifth percentile or higher for systolic blood pressure are considered to have hypertension (their systolic blood pressure is higher than 95 percent of all children). Those children ranking between the ninetieth and ninety-fifth percentiles are considered to have prehypertension, and all those ranking less than the ninetieth percentile are considered to have normal blood pressure. So, now we have a definition, and we can state our measure as follows:
Population (denominator): All people who are 18 or younger as of the day prior to the calendar year 2016 and who are seen in the office at least twice during the same year.
Numerator: All people in the population (denominator) whose systolic blood pressure is less than the ninetieth percentile based on age, sex, and height according to the NHLBI blood pressure tables.
Our measure is now specific, but there are still two missing facts that will give different results to those who try to use it. First, children seen during a calendar year have several blood pressure readings. Which reading is the one we want the EHR to report: the first, the most recent, or an average of all systolic blood pressure readings? We decide that the most recent systolic blood pressure reading is best for our measure. When we measure at the end of the year, the most recent will be the last reading during that year, whenever it happened.
Population (denominator): All people who are 18 or younger as of the day prior to the calendar year 2016 and who are seen in the office at least twice during the same year.
Numerator: All people in the population (denominator) whose most recent systolic blood pressure is less than the ninetieth percentile based on age, sex, and height according to the NHLBI blood pressure tables.
Now for the second missing fact: most providers don’t record the percentile rank for systolic blood pressure when recording blood pressure values. The EHRs do have fields for systolic blood pressure, height, sex, and birth date, so all are available to compare to the NHLBI charts and find a percentile rank. However, the information will not be available as a field in the EHR unless the EHR automatically calculates it or providers routinely record it manually. The measure would need to ask for all data required (the birth date, the sex, the most recent height, and the most recent systolic blood pressure) and provide the NHLBI charts with a string of code that any EHR can read to perform the calculation for reporting. Alternatively, EHR products could provide the feature as a standard component, but since that is not a consistent EHR process, we can’t rely on it for our measure. That is why many measures rely on information that can be expected in existing EHR products.
Based on the information we just reviewed, we now tell our measure developer that we have two options. The first is to encourage better standard use of EHRs and work with some EHR vendors to include pediatric blood pressure percentile ranking because it adds value to clinical care. Our second option is to abandon the measure or look for other information that might support our needs. For this hypothetical case, we will take the first option and work with some vendors to develop best practices (evidence) and encourage other vendors and providers to follow their example.
Use Case 22-2: Defining a Quality Measure, Example 2
Request: Identify all adults who have diabetes and whose condition is controlled over time.
Let’s again assume we are working for the measure developer in this case. Just like in the first case, we need to break down the measure into its component parts to be sure the EHR provides the right information to calculate the result. The first question is, “What is the time period of interest?” To clarify, we can state the following:
Population: All adults with diabetes seen during the calendar year 2016.
Now the time period is clear, but we need to be specific about which patients—all of those living in the city, all of those insured by a local health plan, or all of those seen at least twice in the office practice. So, we will choose the last group because it is something the EHR can find for us.
Population: All adults with diabetes seen in the office at least twice during the calendar year 2016.
Getting a bit deeper in the review, we find that the EHR doesn’t identify people as “adults” or “not adults.” So, we need to define what we mean by the term. We generally want to use a common definition, so we will add the following:
Population: All people with diabetes who are at least 18 years of age on the first day of the calendar year 2016 and who are seen in the office at least twice during the same year.
Now we are pretty sure we know those of interest to the measure. We need to be clear, though, about what we mean by “diabetes.” Are we comfortable that the presence of a diagnosis on the problem list is enough to find all diabetics? Or do we also want to find all patients who are receiving medications that are used to treat diabetes so we don’t miss anyone? If we do that, we have to consider excluding any patients receiving such medications for reasons other than diabetes (e.g., those with a diagnosis of polycystic ovarian syndrome). We conclude for this example that the diagnosis on a patient’s problem list is sufficient. This population is our denominator, the group in which we have interest.
Now we need to define what is meant by good control. Reviewing the evidence, we find that a blood test, hemoglobin A1c (HbA1c), is a good indicator of diabetes control over a period of several months. So, we have a way to measure blood glucose control. And we find several reports about what level of HbA1c should be used to decide whether that control is good. So, we ask a panel of experts to convene and conclude which level should be used in the measure so that the measure identifies patients who are well controlled but is not set so low that that it might lead to possible harm, or unintended consequences. By setting the level too low, we could find that some providers manage their patients too strictly so they perform well on the measure but that strict management causes some patients to have significant side effects and harm from blood sugars that are too low. Remember, any decisions we make in this example are presented only as examples for this hypothetical case. Panels of experts will come to different conclusions than those presented here, but the example is included to show the real concerns measure developers deal with every day.
Now, based on our review, we decide not to look for a specific value of HgA1c to determine good control. Instead, we decide to look for patients who have results that most agree are out of control (HgA1c values greater than or equal to 9) and who improve over time.
Population (denominator): All people with diabetes who are at least 18 years of age on the first day of the calendar year 2016 and who are seen in the office at least twice during the same year.
Numerator: All patients in the denominator with HgA1c values >= 9 who improve their control during the measurement year.
Now we are a bit clearer, but we still haven’t noted what is meant by improvement. So, we specify that improvement should be a change in the HgA1c result of at least 1. But we also need to define over what time frame that improvement should be expected. Based on the nature of the test we are using to determine control or lack of control, we conclude that there should be at least a six-month interval between the tests. That means that only patients whose first test was performed between January and June will qualify for the measure, and we realize we need to add to our denominator. We also decide (again for this example) that a second HgA1c test should be expected for all patients not in control during the measurement year.
Population (denominator): All people with diabetes who are at least 18 years of age on the first day of the calendar year 2016 and who are seen in the office at least twice during the same year and who have HgA1c results obtained in the first six months of the year with a result of >= 9.
Numerator: All patients in the denominator with HgA1c values >= 9 who have a second HgA1c result obtained at least six months after the first that occurs during the measurement year and whose HgA1c value is less than the initial value by at least 1.
This is a bit more complex than our first example. Now we need to figure out how to tell the EHR to find the two values and to calculate the difference. Providers don’t routinely document change over time in any standard way, but EHRs do capture results. So, we define a measure element delta (change over time) and explain to the EHR from what data the change should be derived.
Population (denominator): All people with diabetes who are at least 18 years of age on the first day of the calendar year 2016 and who are seen in the office at least twice during the same year and who have HgA1c results obtained in the first six months of the year with a result of >= 9.
Numerator: All patients in the denominator with HgA1c values >= 9 who have an HgA1c delta of >=1 derived from the first HgA1c result during the measurement year and the most recent HgA1c result that was performed at least six months after the first, and both must occur during the measurement year.
Now the EHR vendor and provider are clearer about exactly what we want to be reported.
TIP For questions about the specific elements used in a quality measure, go directly to the developer of the measure to clarify anything that seems ambiguous.
What Makes a Quality Measure Worth Measuring?
It is important to avoid measuring for the sake of measurement—that is, to avoid the inclination to measure merely because it is in vogue. Measurement should be based on an established need to change the status quo (e.g., insufficient care, too much care, unsafe care, or less than desirable outcomes) for which evidence shows that a change is effective. Evaluating evidence of processes that work requires some basic understanding of research and how such research is used to recommend guidelines for clinical practice. A research study is a process that records information (data) for a group of people to answer questions about a healthcare problem.13 Definitions of types of studies used to evaluate evidence for measurement are available from the Agency for Healthcare Research and Quality (AHRQ) and the National Cancer Institute (NCI).13, 14
Evidence-Based Clinical Practice Guidelines
Medical specialty societies, government agencies, and other organizations develop clinical practice guidelines intended to help providers and patients directly apply the findings of the research into the care patients receive.15 Because clinical studies often carefully select patients for evaluation, the guidelines developed from them generally are careful to recommend treatments only to patients who are similar to those evaluated in the studies. Those patients who are similar to those in the clinical studies are generally included. That means a guideline based on a study of treatment for a specific disease in patients younger than 65 might apply only to patients 65 and younger. Patients older than 65 may be excluded. Criteria such as gender, age, type of disease being treated, previous treatments, and other medical conditions can be used as inclusion or exclusion criteria.16 It has become increasingly common for clinical practice guidelines to carefully evaluate the strength of the evidence for each recommendation (based on the number and types of research studies) and to grade the recommendations. A carefully developed evaluation and grading method was developed and is maintained by the U.S. Preventive Services Task Force (USPSTF). The USPSTF assigns letter grades to its recommendations (A, B, C, D, and I). An “A” recommendation has the strongest support, and “D” is not supported; “I” is inconclusive.16 The USPSTF further ranks the certainty (the level of evidence) as high, moderate, or low. Many medical specialty societies and other clinical guideline developers use the same or modified grading for their recommendations to help providers and patients decide how to apply the guidelines to their own care.
Clinical practice guidelines have been available for some time. A good source for established clinical practice guidelines is the Agency for Healthcare Research and Quality (AHRQ) National Guideline Clearinghouse.17 But changing practice based on the research and the guidelines does not happen automatically. Translating research into practice can take up to two decades.18 Even with good evidence and clinical practice guidelines, a large percentage of people in the United States were still not receiving routine preventive services in 2003.19 For that reason, many have put their hopes in the electronic health record to help turn the tide and deliver the right care at the right time. EHRs provide the opportunity to influence the provider’s behavior at the time they interact with it to enter or retrieve information. Actions designed to provide that influence are often called clinical decision support (CDS). Much has been written about CDS, and you can refer to Chapter 19 for an introduction and to other sources for further details.20
What Is the Connection Between Clinical Decision Support and Quality Measurement?
It is important to note the direct connection between CDS, efforts to influence behavior at the right time within the process of care, and quality measurement that evaluates whether the expected services were provided or whether the patient’s status improved as expected. For example, CDS helps to make sure a diabetic patient has a hemoglobin A1c (HbA1c) blood test to make sure their diabetes is controlled over time. After all is said and done, quality measurement evaluates whether the test was performed and whether the result shows good control of the patient’s diabetes. Both rely on the same information: that the HbA1c blood test was ordered and processed by the clinical laboratory and that the result is available and in normal range. But each uses that information differently. If CDS determines the test was not performed or the result is out of range, it can be programmed to encourage the provider to order the test, or if the result is high, it can be programmed to take action to improve the patient’s blood sugar control. The quality measure uses the same information to see, over time, what percentage of the provider’s patients with diabetes had the test done and how many had results in normal range. Rule-based CDS relies on a trigger or triggers that activate a rule, input data that the rule uses to evaluate what needs to happen, a set of interventions the computer system can choose from to deliver information to the provider, and action steps delivered to the provider to recommend how to help the patient improve (Figure 22-1).

Figure 22-1 Clinical decision support requires four components: the triggers, input data, interventions, and action steps.21
In summary, Figure 22-2 shows the close linkage between quality measures and clinical decision support. Both are driven by the same clinical knowledge. Each requires similar data, and each plays a role in evaluating clinical performance.

Figure 22-2 Relationship of clinical knowledge, CDS, and quality measures to encourage data capture and reuse to enhance clinical performance and report on quality processes and outcomes21
What Is the Measure of a Measure?
To ensure that measures meet the needs of those who use them, it is important to manage the quality, the impact, and the value of the information they produce. Regulatory and governmental organizations require the reporting of financial and clinical patient-level data for performance measurement. Some of these programs incorporate a pay-for-performance component such that healthcare organizations and clinicians are held accountable for their performance by variation in reimbursement.22 The Affordable Care Act allows the Centers for Medicare and Medicaid Services (CMS) to develop new models of payment for care that share cost savings between CMS and the accountable-care organizations (ACOs). These payments are directly linked to the ACO’s performance in quality measures that affect patient and caregiver experience of care, care coordination, patient safety, preventive health, and health provided for at-risk populations and the frail or elderly.23 To ensure the measures used have the impact expected to support the ACO programs, a stringent process of review is needed. National Quality Forum (NQF) supports that need by using a formal consensus development process to endorse measures for quality performance and public reporting.24 Criteria are summarized here, including importance to measure, scientific acceptability, usability, and feasibility:
• Importance to measure and report The extent to which the measure focus is important in order to make significant gains in healthcare quality (safety, timeliness, effectiveness, efficiency, equity, patient centeredness) and to improve health outcomes for a specific high-impact aspect of healthcare where there is variation in overall poor performance.
• Scientific acceptability of the measure properties The extent to which the results of the measure are consistent (reliable) and credible (valid) if it is implemented as specified. Scientific acceptability assessment includes reviewing reliability, validity, exclusion criteria, risk assessment strategy, scoring methods, the comparability of multiple data sources, and the methods to determine potential disparities in care provided. Also highly important is the extent to which those who will use the measure can understand the results and use them to make meaningful decisions (usability) and the extent to which the data required to compute the measure are readily available without undue burden and can be implemented (feasibility).
Endorsement evaluates the rigor of the measure. It is also important to select measures for use in individual programs that evaluate care provided. NQF convenes the Measure Application Partnership (MAP), a public-private partnership to providing input to the U.S. Department of Health and Human Services (HHS) about what performance measures it should select for public reporting and performance-based payment programs as required in the Affordable Care Act. The MAP is a comprehensive, multistakeholder group that includes input and comment from the public at large to share expertise on aspects of improving healthcare. Guided by the National Quality Strategy,25 measures are recommended and provide input that addresses national healthcare priorities and goals, such as making care safer and ensuring that people and families are engaged as partners in their care.26
What Are the Types of Measures, and How Are They Different?
Measures can evaluate performance related to different aspects of health and healthcare. Several classification systems are available to describe measures. Donabedian defined three dimensions of quality that have become the backbone of how the industry defines measurement: structure, process, and outcomes.27
What Are the Expectations for the EHR to Perform Measurement?
The current process for measuring quality using EHRs is evolving. Most existing measures have not been written in a format to allow direct queries to EHRs to extract data. Much of the information needed to evaluate these existing measures is based on information from claims submitted for payment or from human abstractors who review medical records in detail to know whether the measure criteria are met. Some measures use clinical data included in claims attachments, specifically laboratory results and pharmacy-dispensing data. Using such clinically enriched claims information is a step forward for measurement, but it is not able to take advantage of the potentially rich information present in the EHR. So, to implement measures that describe clinical data, the process continues to use traditional manual methods to interpret the measure to evaluate available information. This effort can include medical record abstraction, natural-language processing methods to find information from unstructured (free text) fields in the EHR, or specific fields in the EHR for clinicians to enter the data using drop-down menus or check boxes.
Adding additional fields for clinician data entry is very costly. It takes significant time and effort, it increases the likelihood of incorrect entry of information, and it is not part of the patient care workflow, so it takes time away from caring for the patient. Using check boxes further limits the value of the data since the information is an interpretation of what should be captured directly as a result of the patient interaction, in other words, the provider’s statement about that interaction or confirmation. For example, checking a box that the patient’s systolic blood pressure is less than 140 mmHg makes the provider interpret a result already captured and attest it is correct. Capturing the result itself from the EHR as it is initially entered is preferred since it is more accurate and less prone to error. It also comes with the benefit of knowing more information about that result (metadata) such as the method used to obtain it and the date and time it was performed.
Some data can be captured only by checking a box (or performing a similar manual action) to confirm a process has occurred. A good example is medication reconciliation. Medication reconciliation is the process of reviewing the patient’s complete medication regimen at the time of admission, transfer, and discharge and comparing it with the regimen being considered for the new setting of care to avoid duplication, to avoid inadvertently omitting critical medications, and to prevent avoidable interactions among the medications the patient is receiving.28 However, there is no defined set of online clicks that has been determined to automatically know that a provider has reconciled a patient’s medication lists. Therefore, the provider must attest that reconciliation has been performed and is complete by using some sort of check box or signature. Even attempts to reconfigure, or “retool,” measures for the EHR platform used concepts intended for a manual abstraction or provider confirmation process. And the underlying standards (discussed in the next several sections) are still evolving to enable direct queries to an EHR database. So, there is still manual intervention required to use EHR data for measurement. Figure 22-3 shows a stylized process for implementing quality measures in EHRs as it exists today.
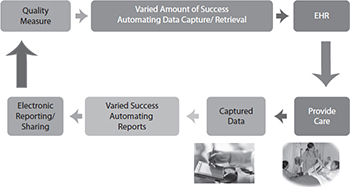
Figure 22-3 Implementing a quality measure in an EHR in 2016 still requires manual effort to interpret the measure and fit it into the provider’s workflow in the EHR.
TIP Ideally, information collected for measures that use EHRs as a data source should include only the data captured as a result of directly caring for patients and only the data that are important to the concurrent (day-to-day) care of the patient. Any request for additional data entry merely for the purpose of administrative or measurement processes will result in dissatisfaction among providers and also reduce the time available to interact with patients.
To resolve potential conflict between measure and clinical care requirements, measurement (i.e., queries to an electronic data source and/or EHR) should be defined using standard terminology and should address clinical workflow and context consistent with that used in the direct process care delivery. Clinical organizations and clinicians will be able to more clearly address quality performance through retrospective analysis and to develop clinical decision support interventions by using carefully defined query formats that are readable by both humans and computers.
There is much work in progress to evolve toward an automated process for measuring quality using electronic information from EHRs. The Centers for Medicare and Medicaid Services (CMS) has an Electronic Clinical Quality Improvement (eCQI) Resource Center that provides access to the most current activities in this area.29 Another fundamentally important resource and organization for the important work of electronic clinical quality improvement, as well as other HIT standards efforts, is HL7, a HIT data standards organization. (Please see Chapter 8 for more information about HL7.) Much of this work originated in 2009 with the HL7 Draft Standard for Trial Use, the Health Quality Measure Format (HQMF). The current work uses an updated version of the HQMF (version 2.1) for the structure, or wrapper, that contains the measure; a data model, or grammar, called the Quality Data Model (QDM), to provide standard data definitions; and a standard grammar and structure to express the information required for the measure elements (Figure 22-4).30 For each concept in the QDM, measure developers create value sets (lists of specific terms and codes that define clinical concepts from standard vocabularies). The QDM concept and the value set more clearly identify the information needed.
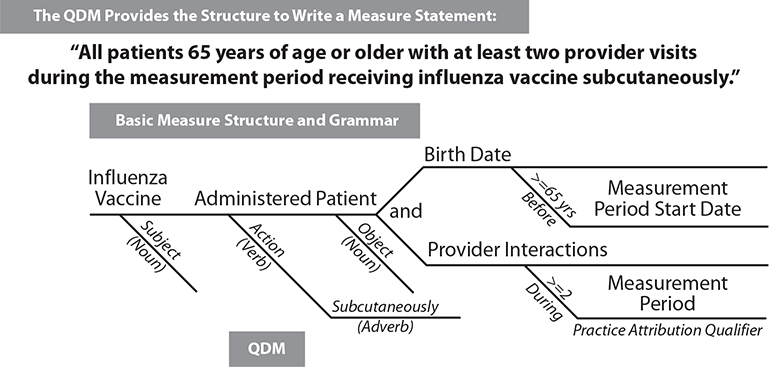
Figure 22-4 Similar to diagramming a sentence, the QDM provides grammar to allow the developer of a measure to state what is needed in a consistent way.
The National Library of Medicine (NLM) Value Set Authority Center (VSAC) provides measure developers with the tools to create value sets from standard vocabularies, keep them up-to-date, and share and reuse them.31 The measure developer can then combine the QDM concepts with the value set to create phrases (also called phenotypes) they can use to construct a measure. The measure developer enters the resulting electronic clinical quality measure (eCQM) in the CMS Measure Authoring Tool (MAT), which constructs an HQMF file containing underlying XML code for use at practice sites (Figure 22-5).32 The HL7 Clinical Quality Information Workgroup maintains the HQMF and an implementation guide for using it with the QDM (QDM-based HQMF Implementation Guide).33 EHR software then implements the measure by extracting information from the measure-specific HQMF file, retrieving the data, and reports the results in a report file called the Quality Report Document Architecture (QRDA). QRDA has two versions—QRDA Category I allows reporting of a single patient’s measurement data; QRDA Category III allows reporting of a summary report of all patients who meet measure criteria for a hospital or ambulatory provider. The initial intent was to create a middle tier, or Category II standard, to allow reporting detailed data for all patients who meet measure criteria but the detailed requirements were never fully defined.
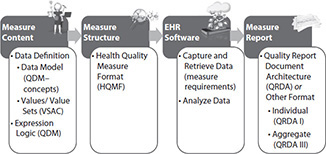
Figure 22-5 Measure development infrastructure—2016 version
TIP The HQMF is the standard to incorporate eCQMs into the EHR.
What Changes Are Needed to Enable Electronic Clinical Quality Measures?
The initial implementation of eCQMs provides significant insight to decide what works and what needs to be modified. Several reports highlight challenges with implementing the first round of eCQMs.34, 35, 36 Three main challenges are noted: measure focus, EHR readiness, and standards maturity.
Measure focus, the first challenge, has two components: legacy measure focus and overcomplexity. Measure focus previously addressed what was available: claims and paper or electronic chart data that could be abstracted manually. Unfortunately, the first round of eCQM development merely retooled or converted existing claims or abstraction-based legacy measures. This created expectations that providers would capture structured, discrete data that previously were extrapolated from other existing information and created excessive clinical workflow changes. It produced less reliable information captured so as to navigate through computer screens more quickly. Measures can also be overburdened by potentially unnecessary exclusions and complex measure logic because they are based on a different paradigm of data capture. Ideally, EHRs are not designed to replicate a paper process. They should be designed and implemented in combination with efforts to improve workflow and enhance a provider’s ability to provide direct patient care. By re-engineering existing measure concepts and creating measures de novo, addressing information as captured during routine clinical care workflow, eCQM feasibility should increase.
The second challenge is EHR readiness. Much of the workflow included in clinical software has been designed to capture information, often replicating the paper documentation process. Addressing information capture without consideration for multiple uses often leads to information that must be reinterpreted or extracted from narrative text for subsequent analysis. While measure developers seek to take advantage of EHR data as a rich source of information, it is not necessarily safe to assume that EHRs consistently have data structured in a way that it can be easily used. In addition, more recent attention to clinical outcomes creates a need to capture structured information about changes in patient status. Previously, it was sufficient to indicate such information in narrative text assessment. As EHR and other clinical software improve mechanisms to capture data to improve clinical quality using CDS consistent with clinicians’ workflow, more information will be available for performance analysis. Focus on these capabilities should increase with greater focus of CMS and insurers on paying for value rather than services provided (i.e., value-based purchasing).37, 38, 39, 40
The third challenge for eCQM development and implementation is standards maturity. The process used in 2016 is that it addresses measurement, but CDS activities use different standards and require a more computable expression language. The Office of the National Coordinator for Health Information Technology (ONC) established the Standards and Interoperability (S&I) Framework Clinical Quality Framework (CQF) initiative to merge, or harmonize, the measure development and CDS efforts and thus achieve a single method to improve and evaluate clinical performance.41 Initiated in March 2014, the CQF efforts developed new standards to address clinical quality, combining the measure and CDS requirements, and shepherded them through HL7. These standards created a more operational data model, Quality Information and Clinical Knowledge (QUICK); a more readable expression language that is also computable, Clinical Quality Language (CQL); and a new structure to contain the logic expressions for both measurement and CDS, Clinical Reasoning. Clinical Reasoning is a component of a new HL7 initiative called Fast Healthcare Interoperability Resources (FHIR), which is developed based on information that 80 percent of EHRs can manage, reducing the complexity of previous versions of HL7 standards. These new standards (QUICK, CQL, FHIR) are in development and being used for pilot and demonstration projects at the time of this writing, but they have significant promise to provide simpler, more usable standards for sharing information for clinical care and for quality improvement.
As part of the transition to these standards, eCQMs intended for implementation in 2019 should be using the QDM data definitions with CQL logic while still using HQMF. Figure 22-6 depicts a future vision for the quality improvement infrastructure, managing the same information for measurement and CDS to enable performance improvement and determine what works and what needs adjustment.

Figure 22-6 Quality improvement infrastructure—future vision
Figure 22-6 demonstrates how measure developers in the future may use a harmonized data model that addresses needs for measurement and clinical decision support (QUICK) and values or value sets from VSAC. They will use CQL as a more human-readable method to express relationships of data elements to each other that can be interpreted by computers. They will enter the measure information in the Measure Authoring Tool (MAT), which produces a Clinical Reasoning file that provides CDS and measure content. EHR software will then coordinate clinical workflow to enable care improvement and data capture and retrieval, and analyze the data to report results using Clinical Reasoning reports (individual or aggregate).
Data Modeling: Example from the International Health Information Terminology Standards Development Organization
The International Health Information Terminology Standards Development Organization (IHTSDO) defines two methods of modeling.42 A model of meaning represents the underlying meaning in a way that is common to and reusable between different use cases. In contrast, a model of use structures information based on a specific intended use. If, in a hypothetical case, the intended use of a patient’s blood pressure result is for a clinician to view it and make decisions, the information can be captured as text showing the systolic value over the diastolic value similar to an equation (e.g., 136/74). The data were captured and stored based on the use model that defined only a single result without the need for any specific structure. When the clinician decides it is important to follow the blood pressure over time and trend it on a graph, the EHR then needs to parse the result into its component parts and store the systolic value (136) as a number and the diastolic value (74) as a number, both of which are from the same reading.
The new use model requires trending over time, and so the data are now structured. If the original modeling were based on the intended meaning, the EHR vendor would have had to provide an enhanced display, but no change in the underlying data would have been required. Many EHRs managed data input based on use requirements determined at a point in time. Similarly, quality measurement was also based on the use model of human intervention (confirmation or chart abstraction). As both EHRs and measure developers look at achieving clinical outcomes, reuse of captured data becomes increasingly important. Restructuring the process of collecting data based on the data’s meaning will enhance the potential for reusing information and reducing the need for redundant data entry and information restructuring and will enable less cumbersome clinical care, CDS, and quality measurement. In addition, the measurement infrastructure and data can itself be leveraged to encourage standardized data, coding, and tools across the healthcare continuum in a manner that has not yet been seen.
TIP This can occur through use of a standardized data model and standardized value sets.
How Are Value Sets Standardized?
Measures list data elements as criteria. To be sure those implementing the measures enter the right patients and the right information into the analysis, they must carefully explain what information from the clinical record is needed. For example, the term “blood pressure” seems specific, but as discussed earlier, blood pressure is actually a combination of two clinical findings: a systolic blood pressure (when the heart is contracting, or beating) and a diastolic blood pressure (when the heart is resting between beats). Each is measured at the same time. Blood pressure can also be taken at rest; during or after exercise; or in a lying, sitting, or standing position. Each of these qualifiers (metadata) about the blood pressure is important to understand how the finding should be used. So, a measure evaluating diastolic blood pressure to look for improvement needs to clearly indicate what is intended. There are several ways to state what is meant.
• Diastolic blood pressure (qualifier: resting; position: sitting)
• Resting diastolic blood pressure (position: sitting)
• Sitting, resting diastolic blood pressure
The first example uses a basic concept, diastolic blood pressure, and separately describes the attributes, or metadata, required—resting and sitting. It can be stated to post-coordinate an expression, breaking it down into its component parts, each of which has a concept in available code systems (e.g., Systematized Nomenclature of Medicine—Clinical Terms, SNOMED-CT).43 The next example pre-coordinates the concept (i.e., suggest a single concept that incorporates all metadata into one code).
Traditionally, measures have used claims codes to specify which values are acceptable for each data element in their measures. This method has been successful when capturing data from claims, but it is more challenging when looking for information captured during a clinical interaction between a provider and a patient. Claims codes provide general information, but they do not allow clinicians to express what is needed to provide direct care. For example, the provider may want to indicate a specific interaction with the patient through e-mail exchange. The coding system used for most encounter- and procedure-related claims is Clinical Procedural Terminology (CPT),44 which includes a code for an evaluation/management visit for an established patient at different levels of intensity. To accommodate e-mail exchange, CPT added a code, but interactions between other clinicians and patients are not clearly expressed in CPT. A clinical terminology such as SNOMED-CT allows more expression of additional interactions.
As EHRs and quality measures together require more clinical data for evaluation and trending, the use of SNOMED-CT is expected to become prevalent. It is also expected that the information in the EHR will need to be mapped to claims-related code systems for billing purposes. While EHRs may capture the information at the level of detail indicated, they do not consistently store it as a post-coordinated expression. Therefore, collaboration between measure developers and EHR vendors and implementers will be important to resolve potential conflicts.
The terms, or values, used to clearly explain each data element are called a value set. A value set is a set of codes derived from a particular code system, or taxonomy.45 For the previous example, all of the codes for diastolic blood pressure would be included in one value set. Value sets are not static. The code systems from which the values are derived update on a regular basis, retiring some concepts and adding new ones. Therefore, value sets need to be maintained and versioned over time. A clear understanding of the code system used is also critical to be sure the values selected for a value set are complete and correct. To encourage greater consistency, the NLM Value Set Authority Center provides measure developers with access to code systems that allow them to develop and share valid, complete, and reusable value sets.31 The NLM VSAC also curates the value sets to be sure the code system is used as intended and also assists with harmonization of concepts among measure developers to avoid duplication of value sets. The VASC recommends code systems based on recommendations of the Health Information Technology Standards Committee and Policy Committee.46
Moving Forward: Retooling vs. Creating Measures de Novo Based on Data in EHRs
Creating measures de novo based on data in EHRs will take a collaborative effort among measure developers, EHR vendors, data warehouse third-party providers, frontline clinicians, and also patients. The essential issue is to provide the appropriate meaning by asking for the information actually needed from the appropriate individual (e.g., ask for information about education provided by asking the patient if the expected information was learned, as compared to asking the provider to use a check box).
Chapter Review
This chapter discussed some of the challenges inherent in using EHRs to manage data intelligently so that data can be entered once as part of the workflow for usual patient care and reused to improve the care process concurrently with clinical decision support and retrospectively by measuring quality. The change from capturing and reporting information based on a model of use to a model of meaning is not easy, but it has the potential to significantly increase timeliness, efficiency, effectiveness, and safety while reducing redundancy. A consistent model to express information within and among systems is important to enable clear understanding. The Quality Data Model (QDM) provides an initial common technological framework for defining the clinical data necessary to measure performance and accelerate improvement in patients’ quality of care.30 By providing a common grammar to describe the information within quality measures, the QDM enables quality measurement from a variety of electronic sources, and it is applicable to all care settings a patient is likely to interact with in a lifetime. The structure of the QDM describes a data element as the combination of a category of information, the context in which it is used (the state), and specific attributes, or metadata, that help clarify exactly what is needed to evaluate the measure.
Here are the general steps an eCQM developer undergoes:
1. Measure developers decide on the information needed for the measure.
2. The developers use the QDM grammar to describe the category and state (or context) that is acceptable to meet their needs and any related information (attributes).
3. The developers select from existing value sets or create new value sets to indicate the information they need (e.g., the specific medications) using the NLM VSAC. The NLM VSAC provides tools and curation to develop value sets and keeps them current.
4. The developers combine the newly developed data elements with their value sets into phrases that describe more detail about the information needed (e.g., medications administered within one hour before the start of a surgical procedure).
5. The developers combine the phrases into components of the measure (e.g., denominator, numerator). The QDM provides the backbone structure to help those who read the measure to understand clearly what is meant in each measure statement or phrase. The purpose of this process is to let those implementing measures look for the data that is structured in the EHR and report the same information regardless of the EHR product used in each practice or hospital.
This chapter described a combination of efforts to move toward a fully implementable query to measure the quality of care from an EHR. Efforts include a common data model (QDM), the NLM VSAC to standardize and curate value sets, the S&I Framework Clinical Quality Framework to harmonize standards for quality measurement and clinical decision support moving forward, and HL7 to improve existing standards and establish newer standards that can be more easily processed by EHRs and other clinical software. These activities will lead to infrastructure to enable the end-to-end processing of data for measurement. But change requires more than infrastructure. The most effective way to accelerate the movement to fully electronic measurement is through collaboration. Measure developers are increasingly working with EHR vendors and individual practices and hospitals to evaluate feasibility as they develop eCQMs and to test the measures once they are complete. Other efforts, such as the Clinical Quality Framework, enable pilots and demonstration projects using new standards to improve quality through CDS and performance measurement. Development of new, harmonized standards should improve the ability to manage quality from the standpoint of CDS as well as measurement and reporting. You can follow such efforts at the eCQI Resource Center (http://eCQI.healthit.gov).29
Questions
To test your comprehension of the chapter, answer the following questions and then check your answers against the list of correct answers at the end of the chapter.
1. What is a value set?
A. A range of numbers that are normal results for laboratory tests
B. A set of codes chosen by a measure developer to define a data element in a measure
C. The relative strength of recommendations as supported by evidence for the interventions expected in a quality measure
D. The combination of a measure’s validity, reliability, and feasibility that describes its potential use in value-based purchasing programs
2. The chief medical officer of your organization asks you to set up a measure for his research study for all of his patients with high blood pressure whose blood pressure improves after six months, regardless of treatment given. How do you define high blood pressure?
A. Systolic blood pressure of <120 mmHg as you found at the National Heart, Lung, and Blood Institute web site.
B. Diastolic blood pressure of <80 mmHg as you found at the National Heart, Lung, and Blood Institute web site.
C. Blood pressure less than the ninetieth percentile by height, age, and gender per the National Heart, Lung, and Blood Institute web site.
D. You don’t have enough information to proceed and thus ask the CMO for more clarity.
3. You are asked to measure how often doctors in your network evaluate a newborn baby’s home environment for factors that might put them at risk. The factors include lead paint in the home; if the baby’s mother has been screened for postpartum depression; if she has been screened and tested positive and is under treatment; and if there are pets in the home. You cannot find specific fields in your EHR for each of these items. What actions do you take?
A. Immediately add fields to the EHR patient demographic section for Yes/No/Not Applicable responses to (1) lead paint in the home, (2) mother screened for depression, (3) if depressed mother is on treatment, and (4) pets in the home.
B. Request input from an appropriate group of practicing clinicians to determine the workflow to capture and evaluate such information and implement a solution consistent with existing best practice to which the majority agree.
C. Immediately add fields to the EHR patient demographic section for Yes/No/Not Applicable responses to (1) lead paint in the home and (2) pets in the home, and you look in the family history section of the EHR for evidence of depression in the mother.
D. Search the literature to find a screening tool shown to work for another organization and implement it directly in your EHR.
4. Which of the following is the acronym for the standard used to structure the format of an eCQM?
A. QRDA
B. Consolidated CDA
C. HQMF
D. S&I Framework
5. What is a preferred method for creating an eCQM for use in a clinical setting?
A. Scour the literature, find a clinical guideline, develop value sets and create the measure using QDM in the Measure Authoring Tool, then pilot the measure in a clinical setting.
B. Identify the clinical outcomes most significant to the patient population seen by your organization, meet with local clinical experts to evaluate best practices to achieve those outcomes, incorporate capturing the required data as part of routine clinical workflow and assure it works, then prototype the measure for review prior to entering it into the Measure Authoring Tool for testing.
C. Identify the clinical outcomes most significant to the patient population seen by your organization, meet with local clinical experts to select the most relevant clinical guideline, identify existing value sets in VSAC and create new ones as needed, then enter the measure into the Measure Authoring Tool for testing and modification of clinical workflow.
D. Select a measure that already exists and consider how to adjust local clinical workflow to capture the required data, retrieve it, and measure.
6. What are three dimensions of quality defined by Donabedian that have become the backbone of how the industry defines measurement?
A. Performance, quality, and risks
B. Performance, risks, and security
C. Structure, outcomes, and risks
D. Structure, process, and outcomes
7. Which agency of the government has the Value Set Authority Center (VSAC)?
A. AHRQ
B. NLM
C. FDA
D. CMS
8. Which standards organization developed the Health Quality Measure Format?
A. The ONC Standards Committee
B. ANSI
C. NCQF
D. HL7
Answers
1. B. A value set is a set of codes chosen by a measure developer to define a data element in a measure.
2. D. You don’t have enough information to proceed and ask for more clarity. Measures require precise definition and often require inclusion and exclusion criteria. The information provided by the chief medical officer was not precise as to the definition of blood pressure and high blood pressure is age dependent.
3. B. Request input from an appropriate group of practicing clinicians to determine the workflow to capture and evaluate such information and implement a solution consistent with existing best practice to which the majority agree. Adding additional fields to “hardwire” a solution has the potential for causing dissatisfaction and adding additional burden to the clinician’s workflow without adding substantial benefit. Using fields intended for a different purpose (e.g., family history to determine whether the child’s mother is currently depressed) can lead to finding inaccurate information to support clinical decisions or measure reports. If the information is relevant to the active management of the patient’s care, there is opportunity to configure the EHR and the workflow efficiently.
4. C. The standard to write an eMeasure is HQMF, the Healthcare Quality Measure Format, an HL7 standard.
5. B. The most preferred method for creating an eCQM is to identify the clinical outcomes most significant to the patient population seen by your organization, meet with local clinical experts to evaluate best practices to achieve those outcomes, incorporate capturing the required data as part of routine clinical workflow and assure it works, then prototype the measure for review prior to entering it into the Measure Authoring Tool for testing.
6. D. The three dimensions of quality defined by Donabedian that have become the backbone of how the industry defines measurement are structure, process, and outcomes.
7. B. The Value Set Authority Center (VSAC) is in the National Library of Medicine (NLM).
8. D. HL7 is the standards organization that developed the Health Quality Measure Format (HQMF).
References
1. Harrington, H. J. (1991). Business process improvement: The breakthrough strategy for total quality, productivity, and competitiveness. McGraw-Hill.
2. ASQ: Global Voice of Quality. (n.d.). History of quality. Accessed on September 10, 2016, from http://asq.org/learn-about-quality/history-of-quality/overview/overview.html.
3. Chassin, M. R. (2002). Achieving and sustaining improved quality: Lessons from New York State and cardiac surgery. Health Affairs, 21(4), 40–51. Accessed on September 10, 2016, from http://content.healthaffairs.org/content/21/4/40.long.
4. California Health Care Foundation. (2003). Variations in healthcare quality: Racial, ethnic, and economic disparities in Medicare fee-for-service in California. Accessed on September 10, 2016, from www.chcf.org/publications/2003/07/variations-in-health-care-quality-racial-ethnic-and-economic-disparities-in-medicare-feeforservice-in-california.
5. Dartmouth Atlas of Healthcare. (2016). Home page. Accessed on September 10, 2016, from www.dartmouthatlas.org/.
6. The Joint Commission. (2016). About the Joint Commission. Accessed on September 10, 2016, from https://www.jointcommission.org/about_us/about_the_joint_commission_main.aspx.
7. The Joint Commission. (2016). Performance measurement. Accessed on September 10, 2016, from https://www.jointcommission.org/performance_measurement.aspx.
8. National Committee for Quality Assurance. (n.d.). HEDIS® and performance measurement. Accessed on September 10, 2016, from www.ncqa.org/hedis-quality-measurement.
9. PCPI. (n.d.). Welcome to PCPI®. Accessed on September 10, 2016, from www.thepcpi.org/.
10. National Quality Forum. (2016). Home page. Accessed on September 10, 2016, from www.qualityforum.org.
11. National Quality Forum. (2012). Consensus development process. Accessed on September 10, 2016, from www.qualityforum.org/Measuring_Performance/Consensus_Development_Process.aspx.
12. National Heart, Lung, and Blood Institute. (2008). High blood pressure. Accessed on September 10, 2016, from www.nhlbi.nih.gov/health-pro/guidelines/current/cardiovascular-health-pediatric-guidelines/full-report-chapter-8.
13. Agency for Healthcare Research and Quality. (2012). Glossary of terms. Accessed on September 10, 2016, from www.ahrq.gov/patients-consumers/patient-involvement/healthy-men/glossary/index.html.
14. National Cancer Institute, National Institutes of Health. (2015). NCI dictionary of cancer terms. Accessed on September 10, 2016, from https://www.cancer.gov/publications/dictionaries/cancer-terms.
15. Field, M. J., & Lohr, K. N. (Eds.). (1990). Clinical practice guidelines: Directions for a new program. Institute of Medicine. National Academies Press.
16. U.S. Preventive Services Task Force (USPSTF). (2012). Grade definitions after July 2012. Accessed on September 10, 2016, from https://www.uspreventiveservicestaskforce.org/Page/Name/grade-definitions.
17. Agency for Healthcare Research and Quality. (2016). National Guideline Clearinghouse. Accessed on September 10, 2016, from https://guideline.gov/.
18. Agency for Healthcare Research and Quality. (2001). Translating research into practice (TRIP)-II. Accessed on September 10, 2016, from https://archive.ahrq.gov/research/findings/factsheets/translating/tripfac/trip2fac.html.
19. McGlynn, E. A., Asch, S. M., Adams, J., Keesey, J., Hicks, J., DeCristofaro, A., & Kerr, E. A. (2003). The quality of healthcare delivered to adults in the United States. New England Journal of Medicine, 348(26), 2635–2645.
20. For a general overview of clinical decision support: Osheroff, J. A., Teich, J. M., Middleton, B., Steen, E. B., Wright, A., & Detmer, D. E. (2007). A roadmap for national action on clinical decision support. Journal of the American Medical Informatics Association, 14(2), 141–145; and Osheroff, J. A., Teich, J. M., Levick, D., Saldana, L., Velasco, F., Sittig, D., … Jenders, R. (2012). Improving outcomes with clinical decision support: An implementer’s guide, second edition. HIMSS.
21. National Quality Forum. (2010). Driving quality and performance measurement: A foundation for clinical decision support—A consensus report. Accessed on September 10, 2016, from www.qualityforum.org/Publications/2010/12/Driving_Quality_and_Performance_Measurement_-_A_Foundation_for_Clinical_Decision_Support.aspx.
22. Agency for Healthcare Quality and Research. (2014). Setting performance targets in pay for performance programmes: What can we learn from QOF? Accessed on September 10, 2016, from https://archive.ahrq.gov/news/newsroom/articles-of-interest/20140418.html.
23. HealthCare.gov. (2012). Accountable care organization (ACO). Accessed on September 10, 2016, from https://www.cms.gov/Medicare/Medicare-Fee-for-Service-Payment/ACO/index.html.
24. National Quality Forum. (2016). Consensus development process. Accessed on September 10, 2016, from www.qualityforum.org/Measuring_Performance/Consensus_Development_Process.aspx.
25. Agency for Healthcare Research and Quality. (2016). The national quality strategy. Accessed on September 10, 2016, from https://www.ahrq.gov/workingforquality/.
26. National Quality Forum. (2012). Measure application partnership. Accessed on September 10, 2016, from www.qualityforum.org/setting_priorities/partnership/measure_applications_partnership.aspx.
27. Donabedian, A. (2005). Evaluating the quality of medical care. Milbank Quarterly, 83(4), 691–729.
28. Agency for Healthcare Research and Quality. (2012). Patient safety primers: Medication reconciliation. Accessed on September 10, 2016, from https://psnet.ahrq.gov/primers/primer/1.
29. Centers for Medicare and Medicaid Services, Office of the National Coordinator for Health Information Technology. (2016). Electronic Clinical Quality Improvement (eCQI) Resource Center. Accessed on September 9, 2016, from https://ecqi.healthit.gov/.
30. Centers for Medicare and Medicaid Services, Office of the National Coordinator for Health Information Technology. (2016). eCQI Resource Center: QDM—Introduction to the quality data model. Accessed on September 10, 2016, from https://ecqi.healthit.gov/qdm.
31. National Library of Medicine. (n.d.). VSAC support center. Accessed on September 9, 2016, from https://www.nlm.nih.gov/vsac/support/index.html.
32. Centers for Medicare and Medicaid Services. (n.d.). Measure authoring tool. Accessed on September 9, 2016, from https://www.emeasuretool.cms.gov/.
33. HL7. (2016). Clinical quality information wiki. Accessed on September 10, 2016, from http://wiki.hl7.org/index.php?title=Clinical_Quality_Information.
34. American Hospital Association. (2013). Hospitals face challenges using electronic health records to generate clinical quality measures. Accessed on September 10, 2016, from www.aha.org/research/policy/ecqm.shtml.
35. The Joint Commission. (2016, July). Survey results: Challenges faced by hospitals implementing Clinical Quality Measures (eCQMs). Accessed on September 10, 2016, from https://www.jointcommission.org/survey_results_challenges_faced_by_hospitals_implementing_electronic_clinical_quality_measures_ecqms/.
36. The Health Collaborative. (2015, Nov. 9). Center for Healthcare Transparency Innovation pilot whitepaper: Increasing transparency on the relative cost and quality of healthcare. Accessed on September 10, 2016, from www.nrhi.org/uploads/grcinci-proposal-cht-innovation-pilot-rfp-2014-07-v10-final-draft.pdf.
37. National Business Coalition on Health. (n.d.). Value-based purchasing: A definition. Accessed on September 10, 2016, from www.nationalalliancehealth.org/Value-based-Purchasing-A-Definition.
38. Centers for Medicare and Medicaid Services. (2015, September). Hospital value-based purchasing. Accessed on September 10, 2016, from https://www.cms.gov/Outreach-and-Education/Medicare-Learning-Network-MLN/MLNProducts/downloads/Hospital_VBPurchasing_Fact_Sheet_ICN907664.pdf.
39. Centers for Medicare and Medicaid Services. (n.d.). Home-health value-based purchasing model. Accessed on September 10, 2016, from https://innovation.cms.gov/initiatives/home-health-value-based-purchasing-model.
40. Centers for Medicare and Medicaid Services. (n.d.). Medicare Access and CHIP Reauthorization Act (MACRA) of 2105: Delivery system reform, Medicare payment reform. Accessed on September 10, 2016, from https://www.cms.gov/Medicare/Quality-Initiatives-Patient-Assessment-Instruments/Value-Based-Programs/MACRA-MIPS-and-APMs/MACRA-MIPS-and-APMs.html.
41. S&I Framework. (2016). Clinical quality framework. Accessed on September 10, 2016, from http://wiki.siframework.org/Clinical+Quality+Framework+Initiative.
42. International Health Terminology Standards Development Organization (IHTSDO). (2015, January). SNOMED-CT IHTSDO glossary (draft version, international release). Accessed on September 10, 2016, from http://doc.ihtsdo.org/download/doc_IhtsdoGlossary_Current-en-US_INT_20150131.pdf.
43. National Library of Medicine. (2016). SNOMED-CT. Accessed on September 10, 2016, from https://www.nlm.nih.gov/healthit/snomedct/index.html; and International Health Terminology Standards Development Organization (IHTSDO). (2016). SNOMED-CT. Accessed on September 10, 2016, from www.ihtsdo.org/snomed-ct/.
44. American Medical Association. (2016). Current Procedural Terminology (CPT). Accessed on September 10, 2016, from https://www.ama-assn.org/practice-management/cpt.
45. HL7. (2016). Value set definition standard project. Accessed on September 10, 2016, from http://wiki.hl7.org/index.php?title=Value_Set_Definition_Standard_Project.
46. Office of the National Coordinator for Health Information Technology. (2011). Health Information Technology Policy Committee: Clinical Quality Measures Workgroup and Vocabulary Task Force transmittal letter. Accessed on September 10, 2016, from https://www.healthit.gov/sites/default/files/standards-certification/HITSC_CQMWG_VTF_Transmit_090911.pdf; and Office of the National Coordinator for Health Information Technology. (2016). Health Information Technology Standards Committee: Transitional Vocabulary Task Force transmittal letter. Accessed on September 10, 2016, from https://www.healthit.gov/sites/faca/files/HITSC_TVTF_Transmittal_Letter_2016-01-29.pdf.