
Data analysis and reporting is an important part in the management of a company. Having a system where you can do accounting, invoicing, warehouse management, and all kinds of tasks a company does is great. Dynamics NAV is a good data entry system and offers ways to provide a flow to the information and make it available when it is needed to complete the company's processes. Sales processors enter the sales orders, which are then available to the warehouse employees so that they know what has to be shipped. Once the warehouse employees are done with the shipping, the invoicing people have the needed information to make the invoice.
But companies also need to be able to analyze all this information. Do we ship our orders on time? Which item category is the most profitable? Are our departments generating value for the company? We have to be able to answer these kinds of questions. That is what analysis and reporting can do.
In this chapter, we will see the tools available to analyze Dynamics NAV data, both inside and outside the application.
This chapter covers the following topics:
- Analyzing data using filters and FlowFilters
- Statistics
- Charts
- Reports
- Analysis views
- Account schedules
- Extracting Dynamics NAV data
- Report development
A good and powerful way to view and analyze data is to use filters and FlowFilters inside the application.
We have explained the use of filters in the Navigating through your data section in Chapter 3, Dynamics NAV – General Considerations. Refer to that chapter to get some examples on how to use filters to analyze your data.
In that same chapter we explained what the SIFT technology is and how to define fields on tables to use that technology. What we did not explain in that chapter is that FlowFilters can be applied over the fields defined to use SIFT to narrow-down the calculated results. That is actually what we will be explaining now.
We will be looking at the Chart of Accounts page to explain how to apply FlowFilters and the results they produce.
- Enter
Chart of Accountsin the search box of the Dynamics NAV Windows client. - Select Chart of Accounts.
- The Chart of Accounts page will be shown.
The following screenshot shows part of the Chart of Accounts page. The fields that are shown are No., Name, Net Change, and Balance because these are the relevant fields for this example.
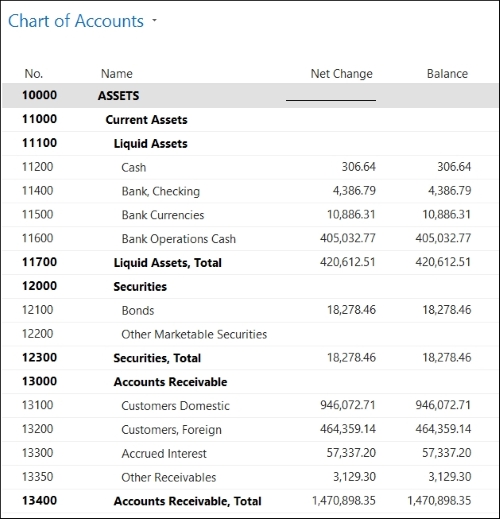
The fields Net Change and Balance are FlowFields that use the SIFT technology. They both show the sum of G/L entry amounts for the different accounts.
Now that we are on a page that uses FlowFields, let's apply FlowFilters and look at the results.
- Click on Chart of Accounts and select Limit totals (or press Ctrl + Shift + F3).
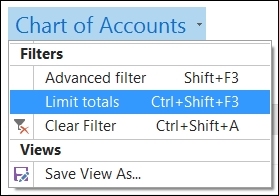
The Limit totals to part will be shown.
- Select Date Filter and set 01/01/17..12/31/17 as the filter.
- The Net Change field will be updated.

Not all FlowFilters apply to all FlowFields; however, FlowFilters only apply to FlowFields. In the preceding example, we saw that after applying a date FlowFilter, the Net Change field got updated and now shows only the sum of G/L entry amounts in the specified period, while the Balance field has remained the same. This is because of the definition of the fields. The definition of the Net Change field states that the calculation of this field will take into account a date filter, while the Balance field does not.
Limit total is the place where a user can apply FlowFilters. It can be found in all the application pages where a FlowFilter is available, and also in the Filter section of reports, which will be seen later in this chapter.