
The debugger starts from the Dynamics NAV Development Environment. The user with which you are logged in must be assigned as a user in SQL Server. Go to Tools | Debugger | Debug Session.
The Session List page will open, as shown in the following screenshot:
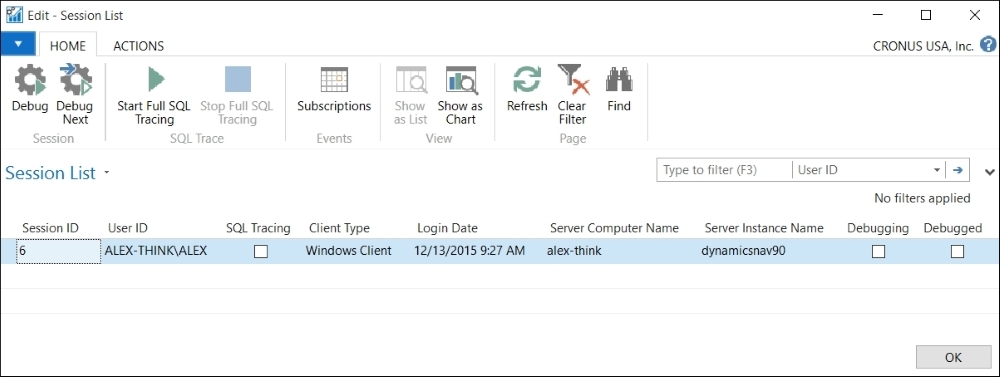
The session you select can be any of the following:
- A Windows Client session
- A Web Client session
- A Tablet or Phone Client session
- An OData Web Services session
- An SOAP Web Services session
- An NAS Services session
Place the cursor on the line corresponding to the session you want to debug and then click on the Debug button from the ribbon bar. You can select your own session or any other session from any other user. You can also click on the Debug Next option to debug a session that is not on the session list. The next session can be a session of any client mentioned previously.
The user won't be able to work with his/her session while you are debugging; therefore, whenever possible, open your own session and debug your session. If you cannot reproduce the bug because of user setup conditions, debug the session of the user that is encountering the problem, but remember to warn him/her.
The Debugger page will now open, as shown in the following screenshot:
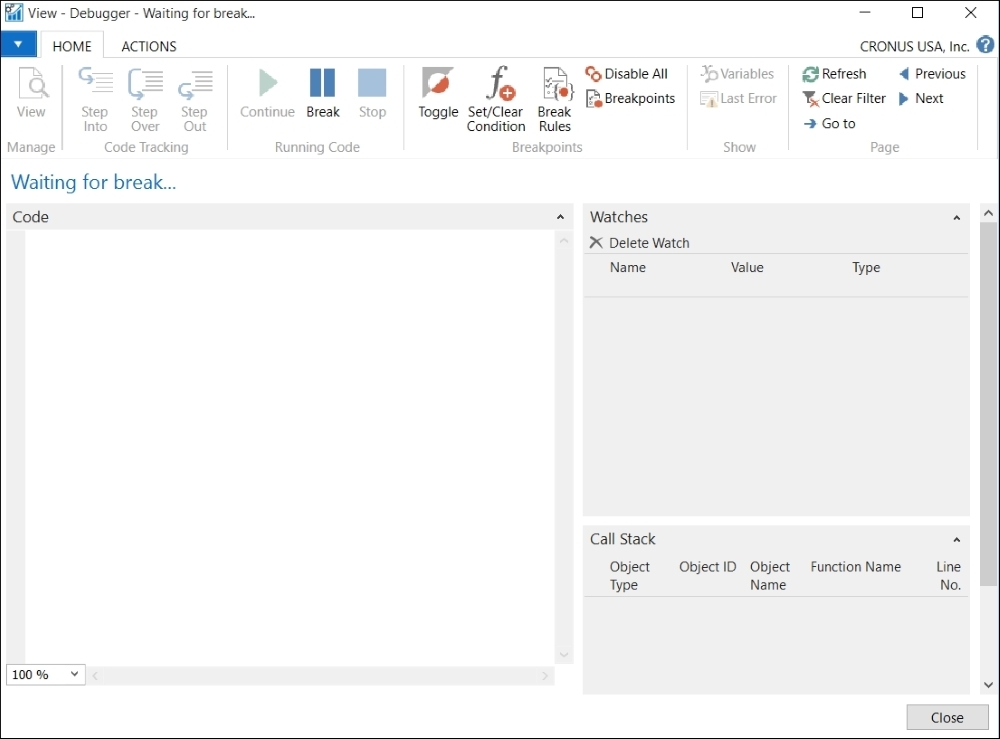
Note that the Code area is blank. You can still work with the session you have selected, but no code appears on the debugger. There are three options to start to debug code:
- Place a breakpoint on an object and wait until the session reaches the breakpoint. The Placing breakpoints section of this chapter explains how to do this.
- Click on the Break icon on the ribbon bar. The debugger will stop on the next line of code that the session executes.
- When the user you're targeting the debugger on runs into an error message using Dynamics NAV.
You will notice that on the Debugger page, you can only see the Code area, but you are missing two important parts that you will need to debug. The Call Stack FactBox is a list that shows the functions and triggers that are currently active. The Watches FactBox will allow you to select variables to see their current value.
This can be considered as the debugger setup. From the Debugger page, click on the Break Rules icon found on the ribbon bar. The Debugger Break Rules page opens, as shown in the following screenshot:

In Dynamics NAV 2016, you can find three basic options on the debugger feature:
- Break On Error: If the debugger is set to Break On Error, it breaks execution both on errors that are handled in code and on unhandled errors. By default, the debugger is set to Break On Error.
- Break On Record Changes: If the debugger is set to Break On Record Changes, it breaks before creating, modifying, or deleting a record. Therefore, the debugger stops on any of the following statements:
INSERT,MODIFY,MODIFYALL,DELETE, andDELETEALL. By default, the debugger is not set to Break On Record Changes. - Skip Codeunit 1: Many of the triggers in codeunit 1 Application Management are not important for debugging a business scenario. This is due to the fact that they are seldom important for debugging and because the codeunit 1 triggers are called frequently in the application. So you can specify that the debugger skips all code in codeunit 1. If you skip codeunit 1, the debugger does not break on code when you break on the next statement in codeunit 1. It continues until the first line of code after codeunit 1. In addition, when you step through the lines of code, the debugger does not step into code in codeunit 1. If you skip codeunit 1, you also implicitly skip all code that is called from codeunit 1.
If you explicitly set a breakpoint in codeunit 1 or in code that is called from codeunit 1, the debugger breaks execution when it hits the specific breakpoint, regardless of whether you have selected the setting to Skip Codeunit 1.
By default, the debugger is set to Skip Codeunit 1.
If the debugger is set up to Break On Error, the best way to determine the cause of a runtime error is to disable all breakpoints and click on Continue. The debugger will automatically stop the execution of the code when it encounters an error.