
- Implementing Microsoft Dynamics NAV Third Edition
- Table of Contents
- Implementing Microsoft Dynamics NAV Third Edition
- Credits
- About the Authors
- About the Reviewers
- www.PacktPub.com
- Preface
- 1. Exploring Microsoft Dynamics NAV – An Introduction
- Understanding Microsoft Dynamics NAV
- The functional areas within Dynamics NAV
- History of Dynamics NAV
- Functional areas
- Accessing Dynamics NAV
- Summary
- 2. What's New in NAV 2016?
- Application changes
- Improvements for the application users
- Tablet client
- New application features
- Automatic payment and bank reconciliation
- Signing up for the Bank Data Conversion Service
- Reconciling payments automatically
- Reconciling bank statements automatically
- Social Listening
- Power Business Intelligence
- RapidStart services
- Schedule reports
- E-mailing documents
- Document exchange service (OCR Services)
- Exchange rates update
- Native integration with Dynamics CRM
- Universal app
- Workflow management
- Posting Preview
- Deferrals
- Development changes
- IT changes
- Summary
- Application changes
- 3. Dynamics NAV – General Considerations
- 4. The Implementation Process – From the Reseller
- 5. The Implementation Process on the Customer Side
- 6. Migrating Data
- Tools to migrate data
- RapidStart Services
- Using XMLports to migrate data
- Writing your own tools
- Converting data from the old system to Dynamics NAV's needs
- Master data
- Open entries
- Historical data
- Open documents
- Choosing a go-live date
- Summary
- Tools to migrate data
- 7. Upgrading Microsoft Dynamics NAV
- Upgrading philosophy
- Upgrades prior to Dynamics NAV 2013
- Upgrades from Dynamics NAV 2013 forward
- Upgrading process checklist
- Upgrading steps to NAV 2013
- Upgrading tools
- Summary
- 8. Development Considerations
- 9. Functional Changes on Existing Implementations
- 10. Data Analysis and Reporting
- 11. Debugging
- 12. Popular Reporting Options with Microsoft Dynamics NAV
- Index
The Call Stack FactBox shows the active functions of the current execution. The Call Stack FactBox gives us information about the function that is currently on execution and also from where this function has been called.
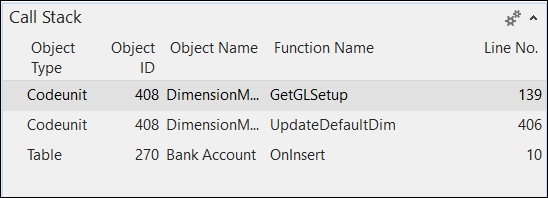
In the preceding screenshot, we can see the call stack corresponding to the code execution we were analyzing in the Step Into option.
We started debugging on the OnInsert trigger of the Bank Account table. We used the Step Into option until we reached a call to the InitSeries function. With this, we kept using the Step Into option until we reached the GetNextNo function. The The Step Into option section stopped there.
This is exactly what we see on the Call Stack FactBox.
The top line shows us the current function, while the bottom line shows the first function from where we started debugging. It also gives us valuable information such as the object that contains the functions that are executed.
You can select any of the lines of the Call Stack FactBox. We have selected the bottom line. Now, in the following screenshot, you can see that the Code area of the debugger changes, showing the code of the line selected on the Call Stack FactBox.
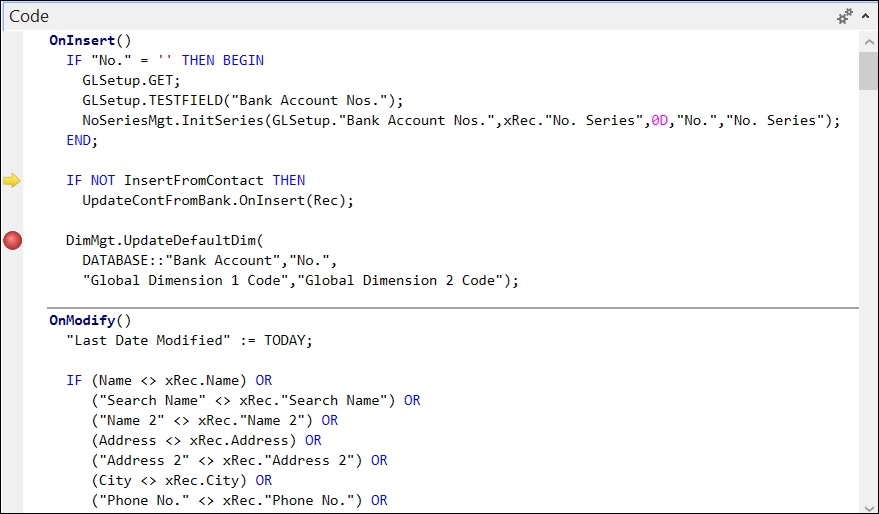
The arrow points to where the code is reading
We can now place a new breakpoint on the function, as can be seen a couple of statements after the green arrow.
-
No Comment