
When the debugger stops the execution of the program flow, you have four options to continue the execution. You can find those options on the ribbon pane of the Debugger page, as shown in the following screenshot:
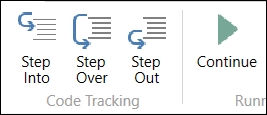
The following is a description of each of the options available to continue execution:
- Step Into: Click on the Step Into icon or press F11 to execute the current statement. If the statement contains a function call, execute the function and break at the first statement inside the function.
- Step Over: Click on the Step Over icon or press F10 to execute the current statement. If the statement contains a function call, execute the function and break at the first statement outside the function.
- Step Out: Click on the Step Out icon or press Shift + F11 to execute the remaining statements in the current function and break at the next statement in the calling function.
- Continue: Click on the Continue icon or press F5 to continue until the next break.
Let's see an example of each execution mode: the insertion of a new record on the Bank Account table. We will use the same example for all the four options.
The Step Into execution starts with the first statement of the
OnInsert trigger of the Bank Account table. The yellow arrow (shown in the following screenshot) shows the line that is currently going to be executed:

If you press F11 (Step Into) repeatedly, you will see how each statement is executed. Four statements later we find a function call. The debugger then stops on the first statement of the InitSeries function. A few statements later, we find a new function call, and the debugger goes to the first statement of the GetNextNo function.
Using these options, the debugger stops on each and every single statement. If you keep on debugging this example, you will see that after pressing F11 a few hundred times and visiting numerous functions and triggers, the new bank account will get inserted.
For a person who wishes to learn the ins and outs of how to develop in Dynamics NAV, going through this process will give you a good sense of what code is run at what time. Many developers learned how the application worked when they started out in NAV development.
Try to avoid this option unless you don't know what you are looking for and you have no other option than executing all the statements one by one, especially for long transactions.
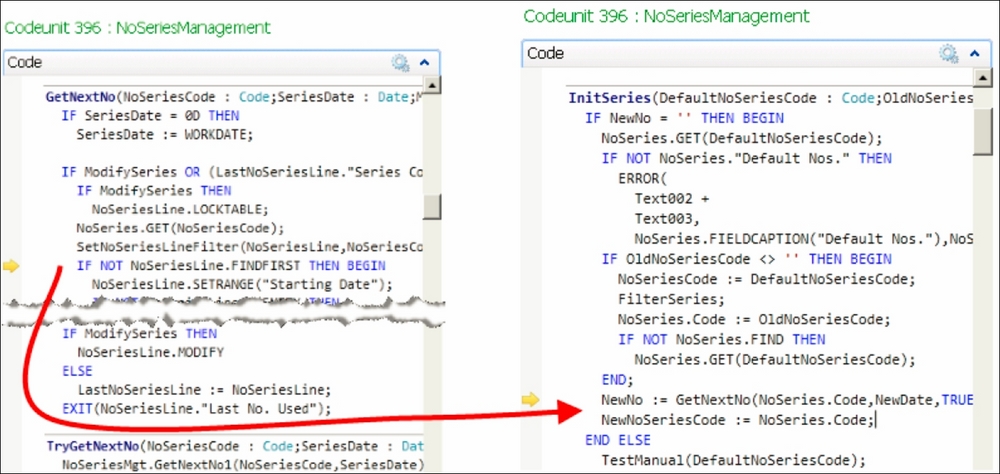
In the last section, we used the Step Into option until we reached the first statement of the GetNextNo function. We will continue debugging from that point, but using the Step Over option, as shown in the following screenshot:

If you press F10 a few times, you will see that the debugger stops on each statement, just as the Step Into option does.
The seventh statement of the function is a call to the SetNoSeriesLineFilter function. If you use the Step Over option on that statement, the debugger will execute all the code inside the function without stopping and will stop on the first statement after the function call, that is, the next statement in the current function.
Use this option when you already know the code that executes inside the function and you know that the function that is going to be called does not contain the bug you are looking for.
In the last section, we used the Step Over option until we reached the first statement after the SetNoSeriesLineFilter function call, which is the GetNextNo function. We will continue debugging from that point, but using the Step Out option. Please refer to the following screenshot before proceeding:
The Step Out option executes all the statements in the current function, and stops on the first statement of the calling function.
We are now on the GetNextNo function that was called from the InitSeries function, as we have seen in the The Step Into option section. If you click on the Step Out option, the debugger will execute all the remaining statements in the GetNextNo function, including the statements inside the new function call. After that, the debugger will stop on the next statement of the calling function, the InitSeries function.
Use this option if you have stepped inside a function to see its code and variables but, once inside the function, you have realized that the bug you are looking for is not there.
In the last section, we used the Step Out option until we reached the next statement after the call of the GetNextNo function. We will continue debugging the code from that point, but using the Continue option.
With the Continue option, the execution of the code continues until:
- A breakpoint is reached.
- We click on the Break option again.
- An error occurs.
Now, click on the Continue option in our example and see what happens.
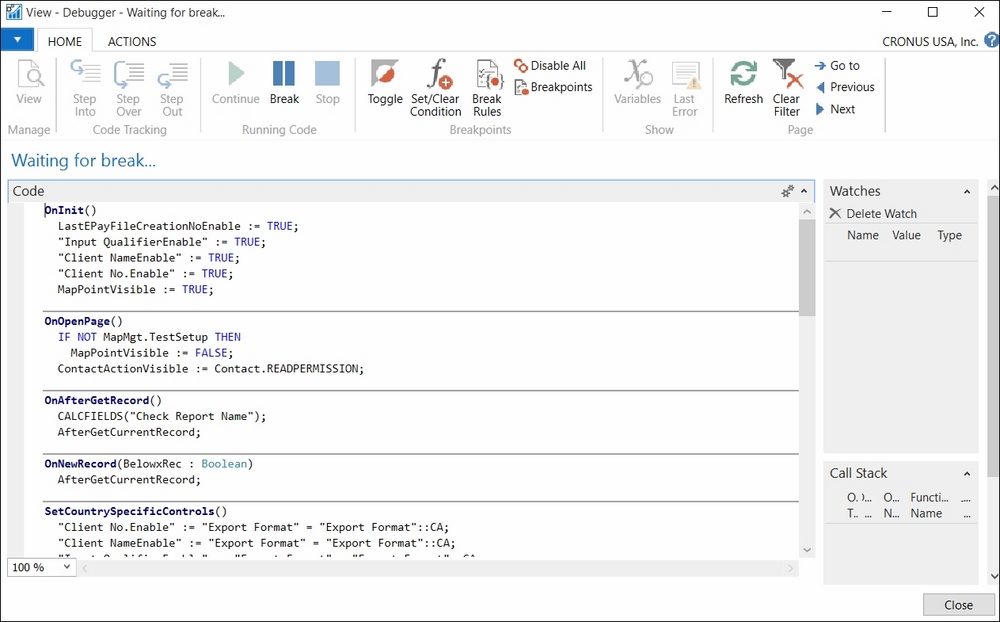
In the Code part of the debugger, we keep seeing the code we had before the Continue option was clicked. But the yellow arrow that showed us the current line is not there anymore. At the top of the preceding screenshot, we can read that the debugger is now waiting for a break.
The execution of the code has continued, a new bank account has been created, the user gets back the control of the execution, and the debugger is waiting for a new breakpoint.
You can use this option if you don't need to follow the code line by line and want to wait for a breakpoint instead. You also can use this option if an error occurs on a process and you want to know where the error has occurred. In this case, you can turn on the debugger, reproduce the process that is causing the problem, and use the Continue option to let the debugger find the line causing the error. Of course, you will need the Break On Error option enabled. You can read the Break Rules section for more information about this option.