Graphical information is always useful when analyzing data. Dynamics NAV offers various ways of viewing data in a graphical way.
Whenever the information shown on the screen can be viewed as a chart, the Home tab of the ribbon will contain a section called View where the users can switch the view of the information from List to Chart, and vice versa.

Let's see an example of how to build a chart based on the customer list:
- Type
Customerin the search box of the Dynamics NAV Windows client. - Select Customers. The customers list will be shown.
- Click on Show as Chart. An empty chart will be shown. We will have to select a measure and the dimensions we want to use to build our chart.
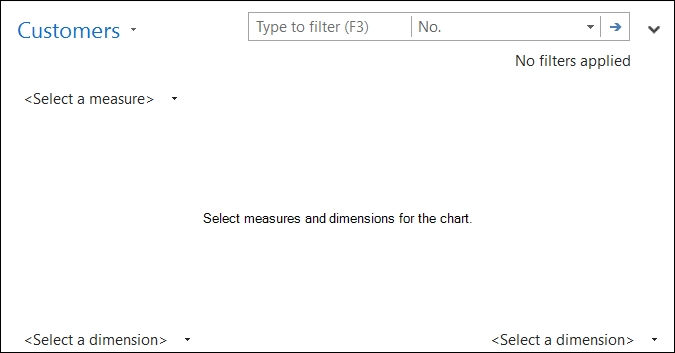
- Select Sales ($) as the measure.
- Select Country/Region Code as the dimension on the right of the chart.
- The chart will be drawn.
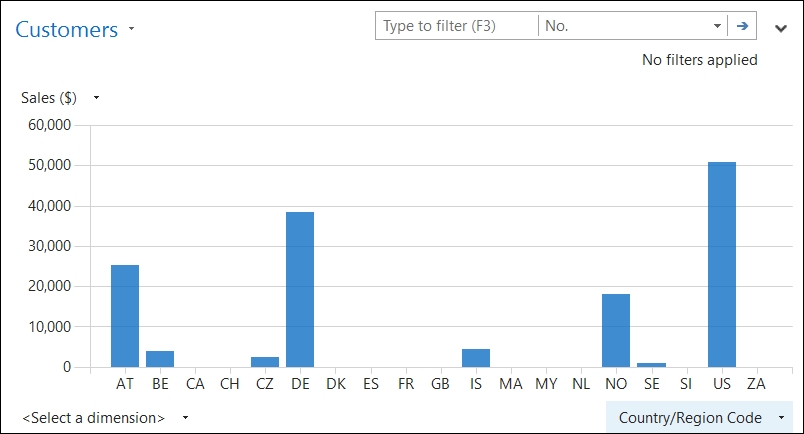
We can quickly see that US is the country where our sales are concentrated.
Dynamics NAV has a set of predefined, generic charts that can be added to the Role Center page.
To add a chart to the home page, follow the given steps:
- Click on Home.
- Click on the Application icon, choose Customize, and then Customize This Page. The Customize the Role Center window will open.
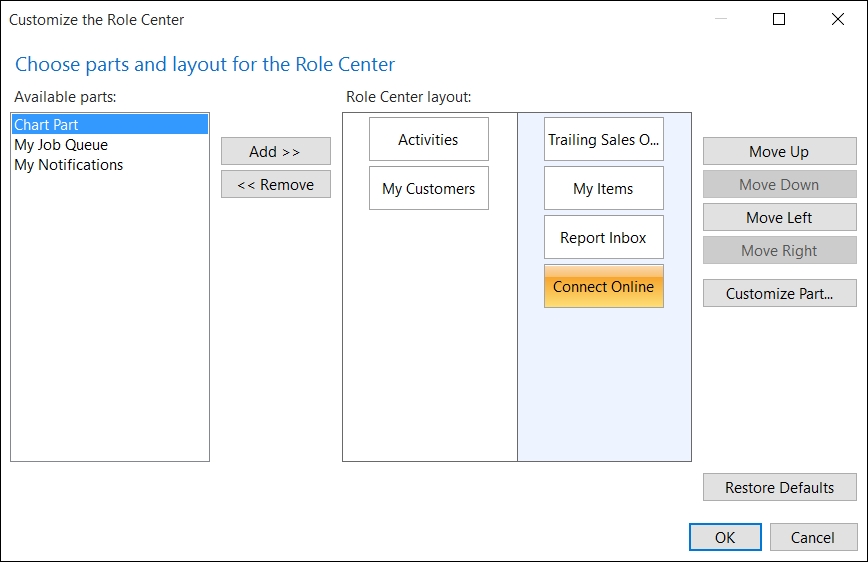
- Select Chart Part from the Available parts field and click on the Add button.
- A Blank Chart will appear in the Role Center layout field.
- Select Blank Chart and click on the Customize Part button. A list of available charts will appear.
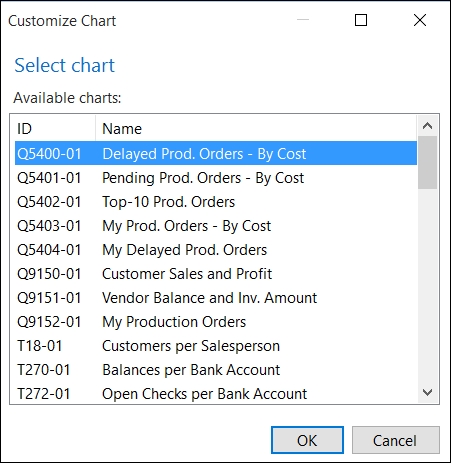
- Select the Customer Sales and Profit chart.
- Click on OK.
- Click on OK to close the Customize the Role Center window.
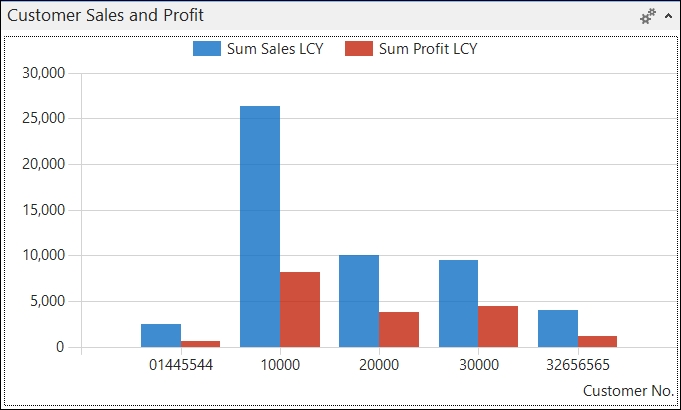
- The selected chart will be displayed on the Role Center page.
If the predefined generic charts are not enough for you, you can define other generic charts and make them available to all the users, so that they can add your chart to their Role Center page.
To create and define a generic chart, follow the given steps:
- Type
Generic Chartsin the search box of the Dynamics NAV Windows client. - Select Generic Charts. The Generic Charts list will be shown.
- Click on New to create a new generic chart.
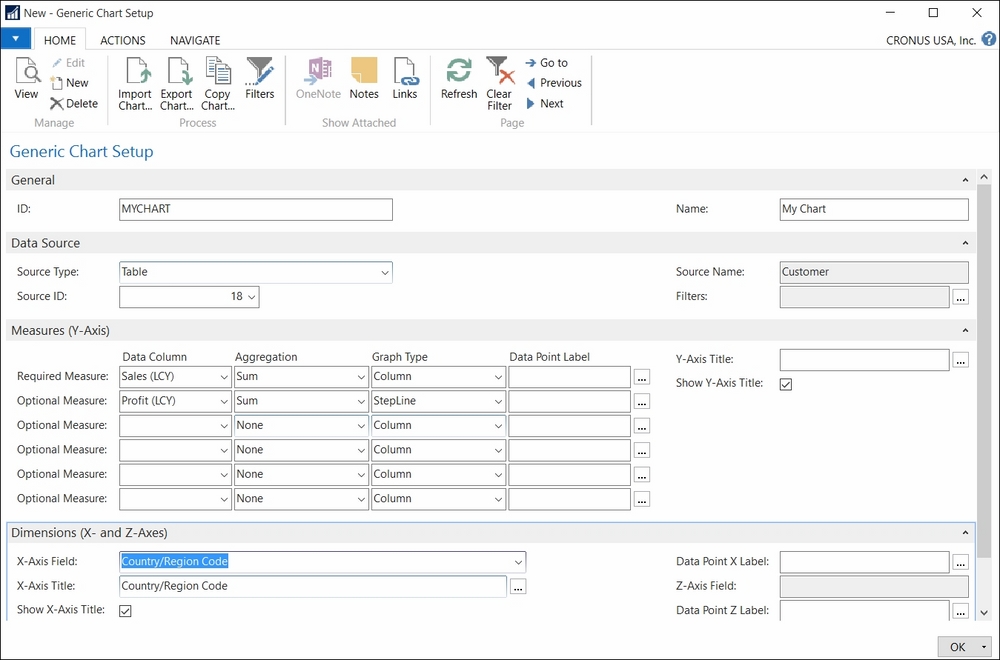
- Give the new generic chart an ID (
MYCHART) and a name (My Chart). - Select Table as Source Type.
- Select 18 as Source ID.
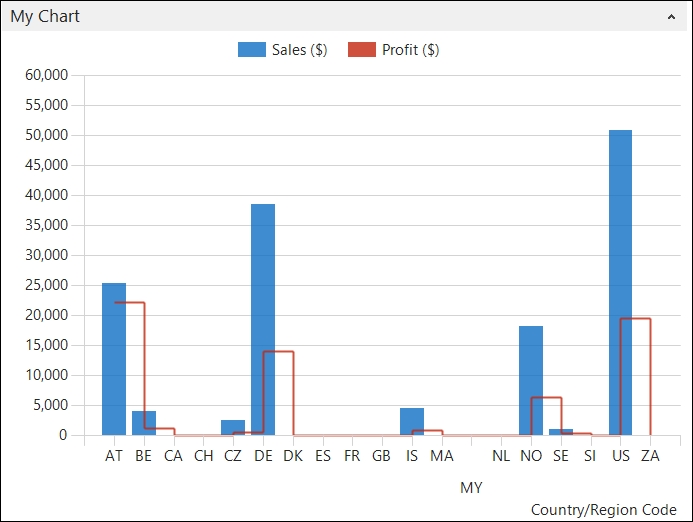
- In the Required Measure row, select Sales (LCY) in the Data Column field, Sum as Aggregation, and Column as Graph Type.
- In the Optional Measure row, select Profit (LCY) in the Data Column field, Sum as Aggregation, and StepLine as Graph Type.
- Select Country/Region Code in X-Axis Field. The entire configuration of the generic chart is shown in the following screenshot:
- Click on OK.
A new chart is now created and configured. Follow the steps in the previous section to add this new chart to your Role Center page. The following screenshot shows the defined chart: