
Dynamics NAV has a bunch of reports that can be used out of the box. Some other reports may have been added by a partner and can also be used.
The first thing you need to know to be able to execute the application reports is where to find them.
To find the application reports, follow the given steps:
- Click on Departments and then select any functional area; Sales & Marketing, for instance.
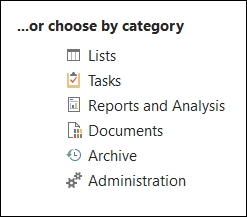
- The main menu for the selected functional area will appear on the screen. Every item you can find inside a menu for an application area has a category associated with it. In the menu, there is a way to view the items according to their category. The following screenshot illustrates the existing categories in Dynamics NAV:
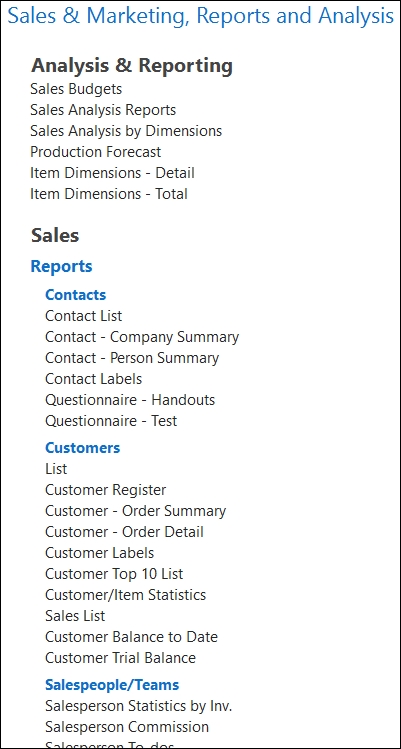
- Select Reports and Analysis.
- All items under the Reports and Analysis category for the functional area selected will be shown.
But reports are not only found on the main menu. They can also be found in many application pages where only the reports that are valuable for the data shown on the page will be found.
Follow the given steps to see an example:
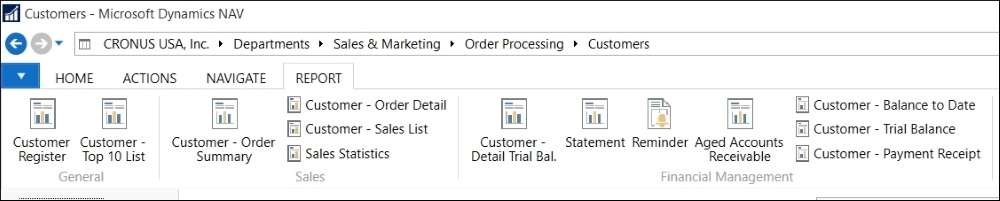
- Click on Departments, then choose Sales & Marketing, and then choose Sales.
- Click on Customers to open the customers list. In the Home tab of the ribbon, a section called Report contains the most relevant reports regarding customers.

On the Report tab of the ribbon, the reports regarding customers will be shown and grouped according to the application area to which they belong.
Now that we have found all the available reports, it is time to execute them and see what kind of information they show. To execute a report, follow the given steps:
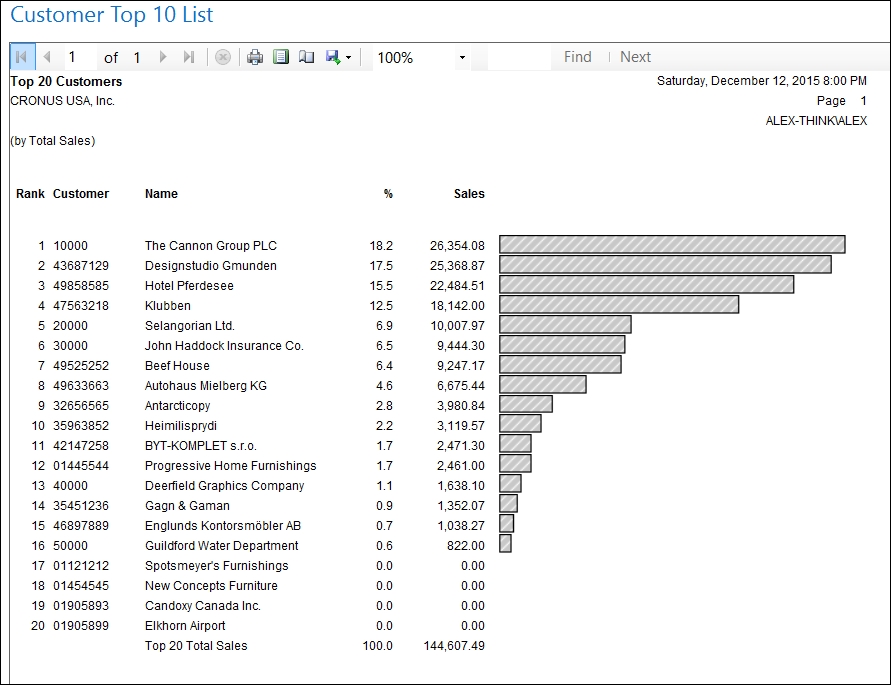
- Click on the report that you want to execute. For instance, click on Customer Top 10 List.
- The Request page for the report will be shown. The following screenshot shows the Request page for the Customer Top 10 List report:
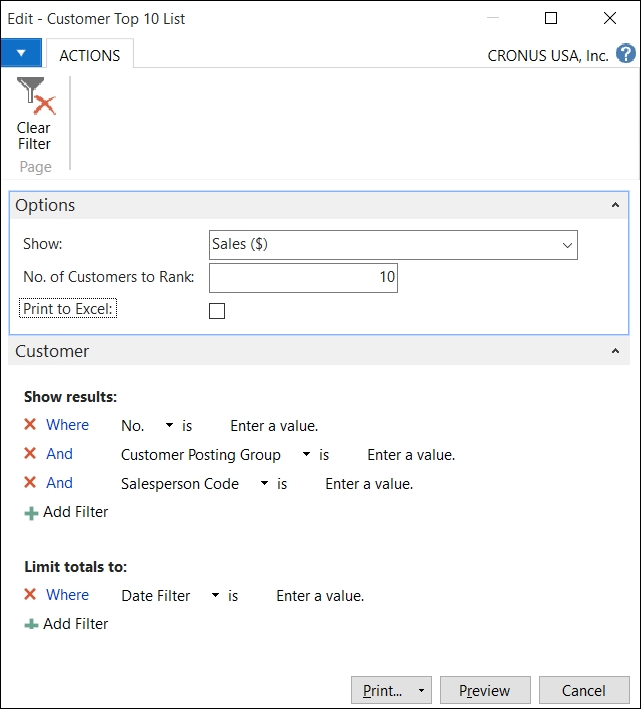
- Request pages for reports have three different sections:
- The Options section: Here the users can choose among different options to define the behavior of the report. This section is always called Options and is shown as the first section of a report request page. The Options section may not be shown in some reports if the report actually has no options for the user to select.
In the Customer Top 10 List report, the Options section is shown and the users have three different fields (Show, No. of Customers to Rank, and Print to Excel) to define what they want to see (using the Show field), how many customers they want to list (using the Quantity field), and if they want to print to Excel in a specific format written into the report.
- The Filter sections: Here the users can apply filters over their data so that the report only shows the data the users are interested in. The Filter sections may take different names depending on which data the filters can be applied to. In the Customer Top 10 List report, the Filter section is called Customer because the filters will be applied over the
Customertable.The Filter sections are always shown after the Options section. A report may have no Filter sections if there are no filters that the users can apply to the data shown in the report, or may have several Filter sections if the report combines data from multiple tables and filters can be applied over the data of the different tables.
The Customer Top 10 List report has a single Filter section, Customer, but the Customer – Order detail report, which can be found under the Reports and Analysis category of the Sales & Marketing functional area, has two Filter sections, Customer and Sales Order Line.
- The Buttons section: Here the users can choose to either Print the report in different formats (print it using one of the available printers in the system by using the Print option, print the report into a PDF archive by using the PDF option, print the report into a Microsoft Word archive by using the Microsoft Word option, or print the report into a Microsoft Excel archive by using the Microsoft Excel option), Schedule the report to be printed at a later time, Preview the report on the screen, or Cancel the execution of the report.

- The Options section: Here the users can choose among different options to define the behavior of the report. This section is always called Options and is shown as the first section of a report request page. The Options section may not be shown in some reports if the report actually has no options for the user to select.
- Click on Preview to see the results of the report on the screen.
Reports in Dynamics NAV have several purposes:
- Reports are used to print information from the database in a structured way
- Reports are used to print documents, such as the Sales Invoice
- Reports are used to automate recurring tasks, such as updating all the prices in an item list
There are different types of reports available in Dynamics NAV.
A list report is intended to print a list of records from a table, usually a table containing master data or secondary master data. Each column contains a field from the table. Most of the data is printed from that table and sometimes brought in or calculated from the other tables. The name of the list report is usually the name of the table followed by the term List.
The following are examples of list reports:
- Customer List
- Inventory List
A test report is printed from unposted transactions, such as entries in a journal or sales/purchase documents. The purpose of this kind of report is to test each line of the journal according to the posting rules so that all errors can be found and fixed before posting. If you try to post and the posting routine encounters an error, the posting routine will stop and will show the first encountered error. If several errors exist, they will be shown and, thus, corrected one at a time. A test report will show all the existing errors. The name of the test report is usually the name of the corresponding Journal, followed by the term Test.
The following are examples of test reports:
- General Journal – Test
- Resource Journal – Test
A posting report prints from a register table. It lists all the transactions (ledger entries) that are posted into the register. This kind of report can be very useful for auditing. The name of the posting report is usually the name of either the register table or the master table of the corresponding ledger entries.
The following are examples of posting reports:
- G/L Register
- Job Register
A transaction report has the following characteristics:
- It lists all the ledger entries for each record in the ledger table.
- It contains a subtotal for each master table record, and a grand total for all the tables printed.
- It is used to view all the transactions for a particular master record.
- It has no standard naming convention. A transaction report usually has one or more data items, including the master and the corresponding ledger table.
The following are examples of transaction reports:
- Detail Trial Balance
- Customer – Detail Trial Bal.
A document report prints a document, such as a Sales Invoice or a Purchase Order. Document reports have a different layout than all the other reports. The header information of the document is printed as if filling out the document at the top of the page and is repeated on every page. The information on the lines of the document resembles other kinds of reports because it is printed in rows and columns. These types of reports are typically modified for every implementation because each company will want the documents sent out to vendors and customers to have their own unique design.
The following are examples of document reports:
- Sales – Invoice
- Order
A user can select which document report will be printed with each document type. To view and select the document reports that will be printed with each document type, follow the given steps:
- Type
Report Selectionin the search box of the Dynamics NAV Windows client. - Select Report Selection Sales. The Edit - Report Selection - Sales window will open.
The following screenshot shows that report number 10076 in the NA (North America) version, which is called Sales - Quote, will be used to print the sales quotes:

By selecting other usages (Order, Invoice, Credit Memo, Shipment, Order Archive, and so on), you will be able to see and choose which report(s) to print for each type of sales document.
By default, there is usually only one report selected for each type of document, but you can add more reports to the list so that more than one record is printed for each document type.
Most reports consist of a tabular listing with records listed horizontally and each field displaying in its own column. Many times, there is a group heading or total to split the lines among various categories and to subtotal the lines by categories.
The following are examples of other reports:
- Customer/Item Sales
- Vendor/Item Purchases