
Here is how we proceed with the recipe:
- As before, we start by loading the necessary modules. We will require TensorFlow, NumPy, and Matplotlib as usual. In this recipe, we are working with the Iris dataset, which contains three classes of 50 instances each, where each class refers to a type of Iris plant. We can either download the data from https://archive.ics.uci.edu/ml/datasets/iris as a .csv file or we can use the dataset module of sklearn (scikit-learn)to do the task:
import numpy as np
import tensorflow as tf
import matplotlib.pyplot as plt
from matplotlib.colors import ListedColormap
# dataset Iris
from sklearn import datasets

%matplotlib inline
- We load the dataset:
# import some data to play with
iris = datasets.load_iris()
x = iris.data[:, :2] # we only take the first two features.
y = iris.target
- Let's see how this dataset looks:
# original data without clustering
plt.scatter(hw_frame[:,0], hw_frame[:,1])
plt.xlabel('Sepia Length')
plt.ylabel('Sepia Width')
Following is the output of the following code:
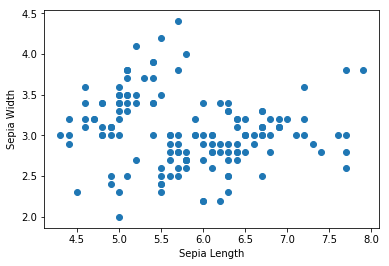
- We can see that there are no clusters obviously visible in the data. Now we define input_fn, which will be used to feed the fit method. Our input function returns a TensorFlow constant, which is assigned the value and shape of x, and is of the type float:
def input_fn():
 return tf.constant(np.array(x), tf.float32, x.shape),None
- Now we use the KmeansClustering class; here, we already know the number of classes as 3, so we set num_clusters=3. Normally, we are not aware of what the number of clusters should be; in that case, a common methodology is the elbow method:
kmeans = tf.contrib.learn.KMeansClustering(num_clusters=3, relative_tolerance=0.0001, random_seed=2)
kmeans.fit(input_fn=input_fn)
- We find the clusters using the clusters() method and, to each input point, we assign the cluster index using the predict_cluster_idx() method:
clusters = kmeans.clusters()
assignments = list(kmeans.predict_cluster_idex(input_fn=input_fn))
- Let's now visualize the clusters created by k-means. To do this, we create a wrapper function ScatterPlot that takes the X and Y values along with the clusters and cluster index of each data point:
def ScatterPlot(X, Y, assignments=None, centers=None):
 if assignments is None:
 assignments = [0] * len(X)
 fig = plt.figure(figsize=(14,8))
 cmap = ListedColormap(['red', 'green', 'blue'])
 plt.scatter(X, Y, c=assignments, cmap=cmap)
 if centers is not None:
 plt.scatter(centers[:, 0], centers[:, 1], c=range(len(centers)),
 marker='+', s=400, cmap=cmap)
 plt.xlabel('Sepia Length')
 plt.ylabel('Sepia Width')
We use it to plot our clusters:
ScatterPlot(x[:,0], x[:,1], assignments, clusters)
The plot is as follows:
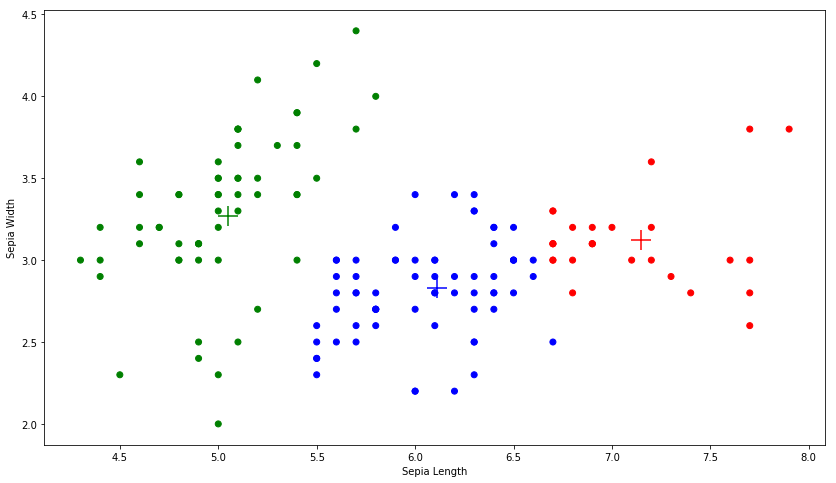
The + marks are the centroids of the three clusters.