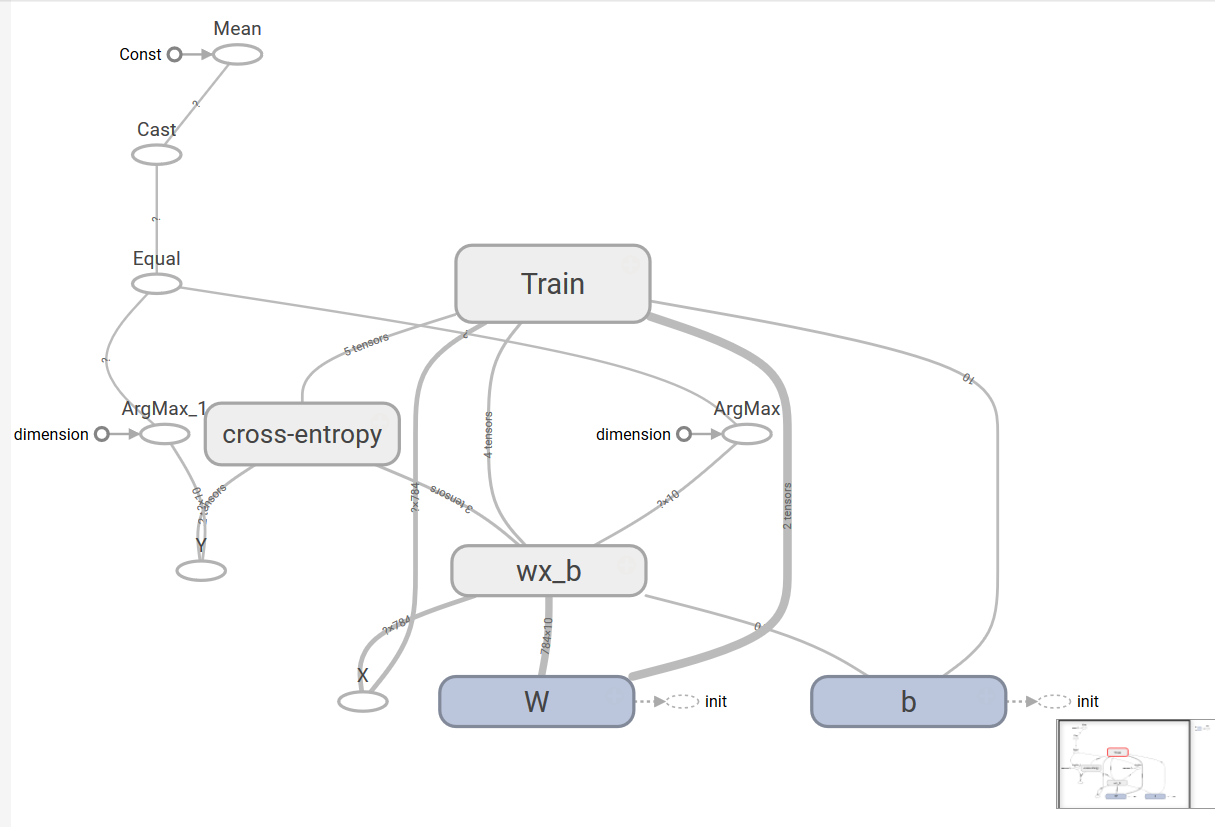
We launch the TensorBoard using the tensor tensorboard --logdir=garphs. In the browser, navigate to the web address localhost:6006, to view the TensorBoard. The graph of the preceding model is as follows:
Under the Histogram tab, we can see the histograms for weights and biases:
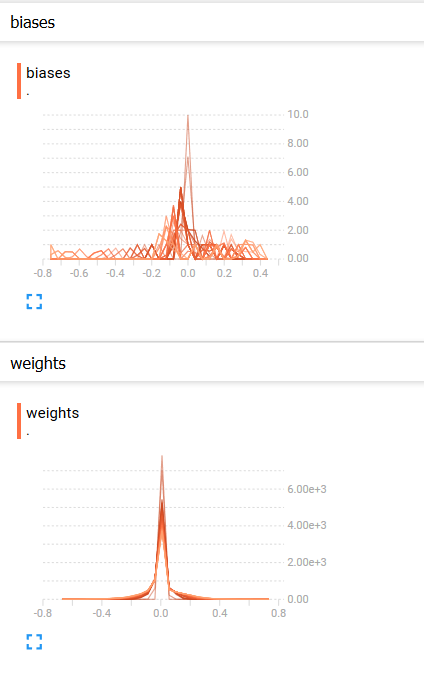
The distribution of weights and biases is as follows:
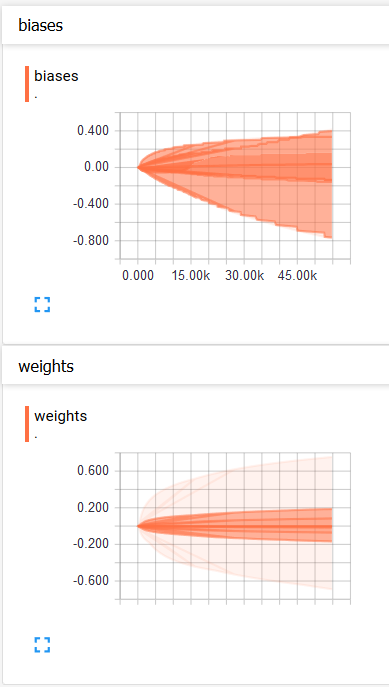
We can see that, with each time step, bias and weight both changed. The bias in our case had a greater spread, which we can see from distributions in TensorBoard.
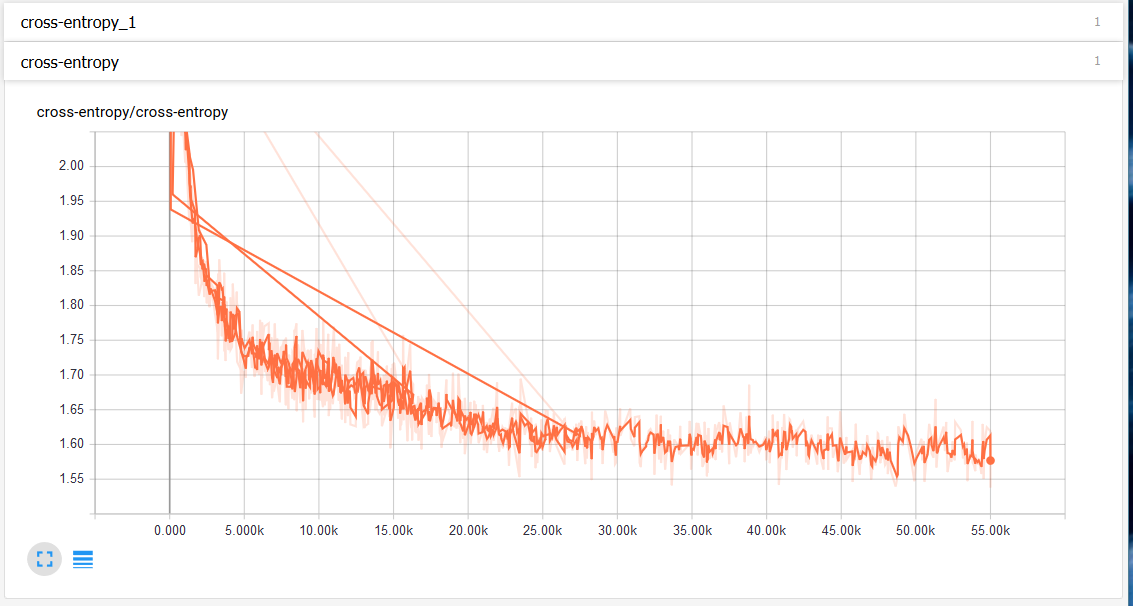
Under the Events tab, we can see the scalar summary, in this case, cross entropy. The following graph shows that cross entropy loss decreases with time: