
The next thing you need to do is create a new .NET 3.5 Framework Smart Device project. Name this project SalesForceDashboard. Use the Device Application template and set the target platform to Windows Mobile 6 Professional SDK.
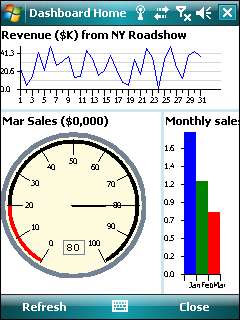
You will now need to create the main dashboard form. Add a new form to your application and name it Dashboard.cs. Using the Windows Forms Splitter and Panel controls, divide the form into three panels (as shown in the following screenshot).
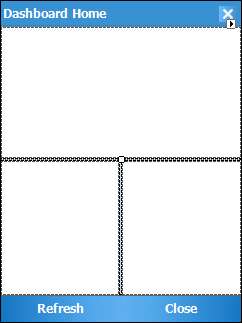
When this form loads up, you will call the remote web service you've created earlier to retrieve the appropriate chart data. Once the data has been retrieved, you will proceed to render the various charts in their respective frame panels.
The Refresh button allows you to refresh the displayed data by making another call to the remote web service to retrieve the latest data. The Close button simply quits the whole application via the following code:
Application.Exit();
To connect to a web service, you must first add a web reference to your project. You've done this earlier in Chapter 6 when you had to connect to a WCF service to synchronize data with a remote server. Right-click on your project, and click on the Add Web Reference menu item.
Browse to the location of your web service's .asmx file and click the Go button to load it. Once the web service is found, name the web reference DashboardDataservice and click the Add Reference button to add this reference to your project.

Now that you have a reference to your web service, let's see how you can call this web service asynchronously from your application.
Note
An asynchronous web service call is a non-blocking call that returns immediately after you execute the request. You specify the address of a call-back function that is automatically invoked when the request completes. Asynchronous web services are commonly used to improve UI responsiveness—the user is free to manipulate the UI while it waits to load data from a web service.
In the code behind the Dashboard form, declare and instantiate a new instance of this web reference:
private DashboardDataService.DataService _service = new
DashboardDataService.DataService();
In the load event of the form, call the RefreshAllCharts method:
public void Dashboard_Load(object sender, System.EventArgs e)
{
RefreshAllCharts();
}
The BeginGetChartData method will initiate the asynchronous web service call for the GetChartData web method. You will need to pass in the two arguments for this web method, as well as the address of the call back function (as an AsyncCallback object). You can pass in null for the last parameter of this function.
private void RefreshAllCharts()
{
_service.BeginGetChartData(DateTime.Now.Year,
DateTime.Now.Month, new
AsyncCallback(BeginGetChartDataCallback), null);
}
Tip
Asynchronous and synchronous web service calls
An asynchronous web service method call has a Begin prefix. To make synchronous (blocking) web service calls, simply use the original web method name itself. Example :_service.GetChartData (DateTime.Now.Year, DateTime.Now.Month)
After the GetChartData web method has completed, your callback function will be invoked. You can declare the callback function shown as follows. You must call the EndGetChartData method to retrieve the return value from the web method.
private void BeginGetChartDataCallback(IAsyncResult Result)
{
String _data;
_data = _service.EndGetChartData(Result);
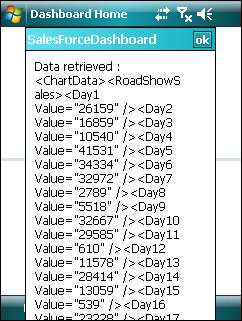
MessageBox.Show("Data retrieved : " + _data);
}
With these few lines of code, you can try connecting to the web service now by running your smart client! Build and deploy this project to the Windows Mobile 6 emulator.
Tip
Ensuring your emulator environment is set up correctly
You must first ensure that your emulator is able to connect to the IIS server in your development environment. For this to happen, an ActiveSync session must first be set up between your development machine and the emulator. Please refer to the Connecting the Windows Mobile emulator to ActiveSync section in Chapter 2 for more details on this. You can test if the emulator can reach the IIS server by navigating to your web service from IE Mobile.
After your application loads, you should be able to see the data retrieved from the web service shown in your emulator.
You're now ready to create your first chart. The first chart is a line chart, which shows the amount of sales for each individual day of the specified month. You can encapsulate the functionality of the line chart in a usercontrol.
Add a new usercontrol named LineChart to your project, and set its background color to pure white. This line chart control will need the data you've retrieved from the web service. You can simply pass in the entire<RoadShowSales> XML node to this usercontrol, via the Datasource property.
private XmlElement _dataSource = null;
public XmlElement Datasource
{
get
{
return _dataSource;
}
set
{
_dataSource = value;
if (_dataSource != null) {AnalyzeData();}
this.Refresh();
}
}
When XML data is passed in via this property, you can call the AnalyzeData() function, which iterates through the XML nodes and retrieves all the data into an array (highlighted as follows).
//The highest value to be displayed in the chart
private int _HighestValue;
//The lower range of the dayscale to display in the chart
private int _DayStart;
//The upper range of the dayscale to display in the chart
private int _DayEnd;
//An array containing values for each day in the dayscale
private long[] _DataValues;
//Extract data from the XML object into an array
private void AnalyzeData()
{
int _counter;
XmlElement _xmlDay;
int _value;
_HighestValue = 0;
_DayStart = 1;
_DayEnd = _dataSource.ChildNodes.Count;
Array.Resize(ref _DataValues, _DayEnd + 1);
for (_counter = 0; _counter <= _dataSource.ChildNodes.Count
- 1; _counter++)
{
_xmlDay = (System.Xml.XmlElement)
(_dataSource.ChildNodes.Item(_counter));
_value = int.Parse(_xmlDay.GetAttribute("Value"));
_DataValues[_counter] = _value;
_HighestValue = Math.Max(_value, _HighestValue);
}
}
The next thing you need to do is to use the GDI+ capability of the .NET Compact Framework to draw the line chart. Add a reference to the System.Drawing library to your project. Make sure you also import this library in your usercontrol.
using System.Drawing;
You can implement your own paint routines by overriding the OnPaint event of the usercontrol. Every time the usercontrol display is changed, for example, during the first time it is loaded, or during a resize, or when another window is moved over it, the OnPaint event is fired.
public void LineChart_Paint(object sender,
System.Windows.Forms.PaintEventArgs e)
{
LoadLineChart(e.Graphics);
}
public void LineChart_Resize(object sender, System.EventArgs e)
{
this.Refresh();
}
Before you create the LoadLineChart method, you will first need to declare a few variables that will be used throughout the line chart control.
//Horizontal margin of the chart
private int _marginX = 20;
//Vertical margin of the chart
private int _marginY = 20;
//Vertical spacing between each gridline
private int _gridlineSpacing = 9;
//Vertical spacing between each label on the Y Axis
private int _YAxisLabelSpacing = 18;
//Number of horizontal pixels to render for each day in the dayscale
private int _XPixelsPerDay;
//Bottom coordinate of the chart area
private int _chartBottom;
//Top coordinate of the chart area
private int _chartTop;
//Left coordinate of the chart area
private int _chartLeft;
//Right coordinate of the chart area
private int _chartRight;
//Height of the chart area
private int _chartHeight;
//Width of the chart area
private int _chartWidth;
//The value that each pixel in the chart area represents vertically
private double _ValuePerChartPixel;
//The base of the number (If in thousands, BaseOfValue = 1000)
GDI+ chartline chart, creatingprivate int _BaseOfValue = 1000;
//Some pens and brushes that will be used for the line chart
private Pen _blackPen = new Pen(Color.Black);
private Pen _bluePen = new Pen(Color.Blue);
private Pen _grayPen = new Pen(Color.LightGray);
private SolidBrush _blackBrush = new SolidBrush(Color.Black);
//Fonts that will be used for the line chart
private Font _stdFont = new Font("Tahoma", 8, FontStyle.Regular);
private Font _boldFont = new Font("Tahoma", 8, FontStyle.Bold);
private Font _smallFont = new Font("Tahoma", 6, FontStyle.Regular);
Note
The Pen object is used to draw lines and polygons (for instance rectangles) while the Brush object is used to fill these rectangles (and other enclosed patterns) with colors or patterns.
Before we proceed, it is useful to take note of the following GDI+ methods:
Now let's take a look at the main bulk of the line chart functionality in LoadLineChart().
private void LoadLineChart(Graphics Graphics)
{
int _counter;
//Calculate chart dimensions
_chartTop = _marginY;
_chartBottom = this.Height - _marginY;
_chartLeft = _marginX;
_chartRight = this.Width - _marginX;
_chartHeight = _chartBottom - _chartTop;
_chartWidth = _chartRight - _chartLeft;
_ValuePerChartPixel = (_HighestValue)/ _chartHeight;
//If no datasource was loaded, show a message to
//indicate that data is currently loading
if (_dataSource == null)
{
Graphics.DrawString("Loading data...", _stdFont,
_blackBrush, 15, 15);
return;
}
//Draw Chart Title
Graphics.DrawString("Revenue ($K) from NY Roadshow",
_boldFont, _blackBrush, 2, 2);
//Draw Y axis
Graphics.DrawLine(_blackPen, _chartLeft, _chartTop,
_chartLeft, _chartBottom);
//Draw X axis
Graphics.DrawLine(_blackPen, _chartLeft, _chartBottom,
_chartRight, _chartBottom);
//Draw gray horizontal gridlines
_counter = _gridlineSpacing;
while (_counter < _chartHeight)
{
Graphics.DrawLine(_grayPen, _chartLeft + 1, _chartBottom
- _counter, _chartRight, _chartBottom - _counter);
_counter = _counter + _gridlineSpacing;
}
//Draw Y axis labels
_counter = 0;
double _LabelValue;
while (_counter < _chartHeight)
//Draw the label hair
Graphics.DrawLine(_blackPen, _chartLeft - 3,
_chartBottom - _counter, _chartLeft - 1, _chartBottom
- _counter);
//Get the value at the label, and convert to the correct base
_LabelValue = _ValuePerChartPixel * _counter;
_LabelValue = _LabelValue / _BaseOfValue;
//Draw the label
Graphics.DrawString(String.Format("{0:#0.00}",
_LabelValue ), _smallFont, _blackBrush, 0,
VAlignMiddle(_chartBottom - _counter));
_counter = _counter + _YAxisLabelSpacing;
}
//Draw X axis labels
_XPixelsPerDay = (int) ((_chartWidth)/ _DayEnd - _DayStart + 1);
int _x = _chartLeft;
int _fromIndex = 0;
int _toIndex = 1;
int _YPos1;
int _YPos2;
for (_counter = _DayStart; _counter <= _DayEnd; _counter++)
{
if (_counter % 2 == 0)
{
//We display a shorter hair line for even-numbered days
Graphics.DrawLine(_blackPen, _x, _chartBottom + 1,
_x, _chartBottom + 3);
}
else
{
//We display a slightly longer hair line for odd-numbered days
Graphics.DrawLine(_blackPen, _x, _chartBottom + 1,
_x, _chartBottom + 6);
//We display labels only for odd-numbered days
Graphics.DrawString(_counter.ToString(), _smallFont,
_blackBrush, _x - 2, _chartBottom + 6);
}
//Draw the lines representing the data
if (_counter < _DayEnd)
{
_YPos1 = ConvertValueToYCoordinate((int)
(_DataValues[_fromIndex]));
_YPos2 = ConvertValueToYCoordinate((int)
(_DataValues[_toIndex]));
Graphics.DrawLine(_bluePen, _x, _YPos1, _x +
_XPixelsPerDay, _YPos2);
_fromIndex++;
_toIndex++;
}
_x += _XPixelsPerDay;
}
}
//This method converts a sales amount into a Y coordinate on //the line chart
private int ConvertValueToYCoordinate(int Value)
{
return _chartBottom - (int) ((Value)/ _ValuePerChartPixel);
}
//This method aligns the Y-axis labels vertically by moving //them up 5 pixels
private int VAlignMiddle(int Y)
{
return Y - 5;
}
That's it for the usercontrol. Back in the dashboard.cs form, add a LoadDashboard() method to the load event. This method will instantiate a new instance of your line chart usercontrol and will place it in the top-most panel of your form.
//Declare an instance of the line chart usercontrol
private LineChart _lineChartControl;
public void Dashboard_Load(object sender, System.EventArgs e)
{
LoadDashboard();
RefreshAllCharts();
}
private void LoadDashboard()
{
_lineChartControl = new LineChart();
_lineChartControl.Dock = DockStyle.Fill;
_lineChartControl.Visible = true;
pnlLineChart.Controls.Add(_lineChartControl);
}
In the BeginGetChartDataCallback() method, you will need to write additional code to parse the XML data retrieved from the web service, look for the node representing the road show sales figures and then pass it to the line chart usercontrol. The changes that you need to make are highlighted as follows:
private delegate void
PopulateLineChartControlDelegate(XmlElement Data);
private void BeginGetChartDataCallback(IAsyncResult Result)
{
string _data;
XmlDocument _xml;
XmlElement _xmlRoot;
XmlElement _xmlRoadShowSales;
XmlElement _xmlTotalSales;
XmlElement _xmlLastThreeMonthSales;
_data = _service.EndGetChartData(Result);
_xml = new XmlDocument();
_xml.LoadXml(_data);
_xmlRoot = (System.Xml.XmlElement) (_xml.FirstChild);
//Look for the road show sales node and load it into the
//line chart control
_xmlRoadShowSales = (System.Xml.XmlElement)
(_xmlRoot.GetElementsByTagName("RoadShowSales")[0]);
PopulateLineChartControlDelegate _linechartDelegate = new
PopulateLineChartControlDelegate (PopulateLineChartControl);
this.BeginInvoke(_linechartDelegate, _xmlRoadShowSales);
}
private void PopulateLineChartControl(XmlElement Data)
{
_lineChartControl.Datasource = Data;
}
Tip
Why use BeginInvoke
You might notice from the code above that we use BeginInvoke() to indirectly pass the XMLElement object to the line chart control. This is necessary because the callback runs on a different thread than the one used to create the usercontrol. The .NET Compact Framework will raise an exception if you try to access the control directly.
Now try running your application to see your line chart spring to life. Notice that you can see the Loading data... message before the chart appears. During this time, the application has asynchronously invoked the remote web service to retrieve the data required for the chart.

The Smart Device Framework (OpenNETCF), as you've encountered earlier in Chapter 5 of this book, provides an out-of-the-box round gauge control that you can readily use in your application. We will now explore how you can make use of this control to display the total monthly sales achieved against the expected sales target.
Note
You first used the Smart Device Framework in Chapter 5. If you haven't installed it yet, you can do so now by downloading the Smart Device Framework from the following URL (via the Download the Community Edition (free) link).
http://opennetcf.com/CompactFramework/Products/SmartDeviceFramework/tabid/65/Default.aspx
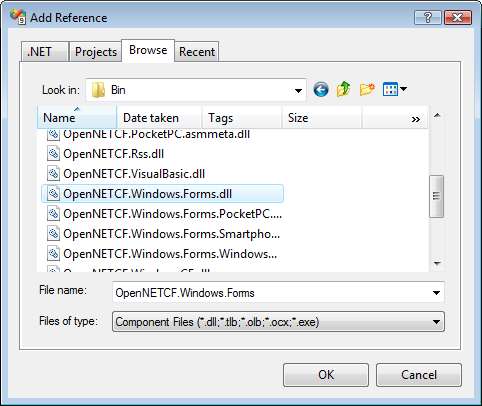
First, add a reference to the OpenNETCF.Windows.Forms.dll library. You might need to browse for this DLL, which is located in the following folder:
Program FilesSmart Device FrameworkBin
After this, create a new usercontrol named GaugeChart. This usercontrol will encapsulate the functionality of the Smart Device Framework's RoundGauge control. You will also load data into your usercontrol by way of a Datasource property, shown as follows:
private XmlElement _dataSource = null;
public XmlElement Datasource
{
get
{
return _dataSource;
}
set
{
_dataSource = value;
LoadGauge();
}
}
The main properties you need to work with on the Smart Device Framework's RoundGauge control are listed as follows:
|
RoundGauge property name |
Description |
|---|---|
|
|
This property defines the minimum value shown in the gauge control. |
|
|
This property defines the maximum value shown in the gauge control |
|
|
This property defines the value that the needle points to in the gauge control. |
Now let's declare some variables that will be used throughout your usercontrol.
//An instance of the Smart Device Framework's Round Gauge control
private RoundGauge _gaugeControl = null;
//The achieved sales amount for the month
private long _totalSalesAmount;
//The expected sales target amount for the month
private long _MonthlySalesTarget;
//The minimum % of sales of which an amount below this value
//is considered critically low
private int _MinimumSalesPercentage = 20;
//The base number for all values on the chart (eg: 1000 means
//in thousands)
private int _BaseOfValue = 10000;
//Fonts and brushes used throughout the GaugeChart usercontrol
private SolidBrush _blackBrush = new SolidBrush(Color.Black);
private Font _smallFont = new Font("Tahoma", 6, FontStyle.Regular);
private Font _stdFont = new Font("Tahoma", 8, FontStyle.Regular);
private Font _boldFont = new Font("Tahoma", 8, FontStyle.Bold);
You can now write the LoadGauge() method, which initializes the gauge control and sets the display values on the gauge.
private void LoadGauge()
{
if (_dataSource != null)
{
//Extracts the data from the XML node
XmlElement _xmlSalesAmount = (System.Xml.XmlElement)
(_dataSource.FirstChild);
_totalSalesAmount =
int.Parse(_xmlSalesAmount.GetAttribute("Value"));
_MonthlySalesTarget =
int.Parse(_xmlSalesAmount.GetAttribute ("MonthlySalesTarget"));
if (_gaugeControl == null)
{
//Create the gauge control
_gaugeControl = new RoundGauge();
_gaugeControl.Name = "TotalSalesGauge";
_gaugeControl.Visible = true;
_gaugeControl.Font = _smallFont;
_gaugeControl.Dock = DockStyle.None;
//Leave some space at the top for the chart title
_gaugeControl.Location = new Point(0, 20);
_gaugeControl.Size = new Size(this.Width, this.Height - 20);
_gaugeControl.Anchor = AnchorStyles.Bottom |
AnchorStyles.Left | AnchorStyles.Right;
_gaugeControl.ShowTickLabels = true;
//Set the gauge values
_gaugeControl.MinValue = 0;
_gaugeControl.MaxValue = ConvertToBaseValue((int)
_MonthlySalesTarget);
_gaugeControl.Value = ConvertToBaseValue((int)
_totalSalesAmount);
//Set other gauge settings
_gaugeControl.ValueDigits = - 1;
_gaugeControl.LineBezelSpacing = 2;
_gaugeControl.TickLabelPadding = 2;
//Sets the warning/critical zone for the gauge
_gaugeControl.LowWarnValue = ConvertToBaseValue((int)
((_MinimumSalesPercentage * _MonthlySalesTarget)/100));
_gaugeControl.LowWarnColor = Color.Red;
_gaugeControl.HighWarnValue =
ConvertToBaseValue((int) _MonthlySalesTarget);
_gaugeControl.HighWarnColor = Color.Black;
this.Controls.Add(_gaugeControl);
//Creates the gauge chart title
Label _gaugeTitle = new Label();
_gaugeTitle.Text =
DateAndTime.MonthName(DateTime.Now.Month, true) +
" Sales ($0,000)";
_gaugeTitle.Visible = true;
_gaugeTitle.Font = _boldFont;
_gaugeTitle.Location = new Point(2, 2);
_gaugeTitle.Size = new Size(this.Width, 20);
_gaugeTitle.BringToFront();
this.Controls.Add(_gaugeTitle);
}
}
}
//This method converts the sales amount into the correct
//figure on the chart using the base number
private int ConvertToBaseValue(int Amount)
{
return (int) ((Amount)/ _BaseOfValue);
}
Now override the OnPaint() event so that you can display the Loading data... message when the gauge chart loads.
public void GaugeChart_Paint(object sender,
System.Windows.Forms.PaintEventArgs e)
{
if (_gaugeControl == null)
{
e.Graphics.DrawString("Loading data...", _stdFont,
_blackBrush, 15, 15);
}
}
Back in dashboard.cs, you need to make the following (highlighted) changes to the LoadDashboard() method.
private GaugeChart _gaugeChartControl;
private void LoadDashboard()
{
_lineChartControl = new LineChart();
_lineChartControl.Dock = DockStyle.Fill;
_lineChartControl.Visible = true;
pnlLineChart.Controls.Add(_lineChartControl);
int _GaugeSize = Math.Min(pnlGauge.Width, pnlGauge.Height);
_gaugeChartControl = new GaugeChart();
_gaugeChartControl.Dock = DockStyle.None;
_gaugeChartControl.Anchor = AnchorStyles.Top |
AnchorStyles.Left | AnchorStyles.Right;
_gaugeChartControl.Location = new Point(0, 0);
_gaugeChartControl.Size = new Size(_GaugeSize, _GaugeSize);
_gaugeChartControl.Visible = true;
pnlGauge.Controls.Add(_gaugeChartControl);
}
In the BeginGetChartDataCallback() method, you need to add the following additional code:
private delegate void
PopulateGaugeChartControlDelegate(XmlElement Data);
private void BeginGetChartDataCallback(IAsyncResult Result)
{
.
.
.
//Look for the total sales amount node and load it into the
//gauge chart control
_xmlTotalSales = (System.Xml.XmlElement)
(_xmlRoot.GetElementsByTagName("TotalSales")[0]);
PopulateGaugeChartControlDelegate _gaugechartDelegate = new PopulateGaugeChartControlDelegate (PopulateGaugeChartControl);
this.BeginInvoke(_gaugechartDelegate, _xmlTotalSales);
}
private void PopulateGaugeChartControl(XmlElement Data)
{
_gaugeChartControl.Datasource = Data;
}
Run your application again to test the gauge chart in action. You will see a display similar to the following diagram. The red zone of the gauge chart indicates the "critical" area, and the label in the middle of the gauge displays the value the needle is pointing to.

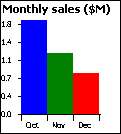
The bar chart is yet another example of a GDI+ chart. This chart displays the amount of sales for the last three months, and is a good demonstration of the GDI+ FillRectangle method.
Add a new usercontrol named BarChart to your project, and set its background color to pure white. You will again pass in XML data via the Datasource property.
private XmlElement _dataSource = null;
public XmlElement Datasource
{
get
{
return _dataSource;
}
set
{
_dataSource = value;
if (_dataSource != null) {AnalyzeData();}
this.Refresh();
}
}
private void AnalyzeData()
{
int _counter;
XmlElement _xmlDay;
int _value;
//Extracts the values from the XML element into an array
_HighestValue = 0;
for (_counter = 0; _counter <= _dataSource.ChildNodes.Count
- 1; _counter++)
{
_xmlDay = (System.Xml.XmlElement)
(_dataSource.ChildNodes.Item(_counter));
_value = int.Parse(_xmlDay.GetAttribute("Value"));
_DataValues[_counter] = _value;
_HighestValue = Math.Max(_value, _HighestValue);
}
}
You also need to declare the following variables that will be used throughout the bar chart.
//The highest value to be displayed in the chart
private int _HighestValue;
//An array containing values for each month in the monthscale
private long[] _DataValues = new long[4];
//Horizontal margin of the chart
private int _marginX = 20;
//Vertical margin of the chart
private int _marginY = 20;
//Vertical spacing between each gridline
private int _gridlineSpacing = 9;
//Vertical spacing between each label on the Y Axis
private int _YAxisLabelSpacing = 18;
//Number of horizontal pixels to render for each day in the dayscale
private int _XPixelsPerDay;
//Bottom coordinate of the chart area
private int _chartBottom;
//Top coordinate of the chart area
private int _chartTop;
//Left coordinate of the chart area
private int _chartLeft;
//Right coordinate of the chart area
private int _chartRight;
//Height of the chart area
private int _chartHeight;
//Width of the chart area
private int _chartWidth;
//The value that each pixel in the chart area represents vertically
private double _ValuePerChartPixel;
//The base of the number
private int _BaseOfValue = 1000000;
//Pens and brushes used throughout the bar chart
private Pen _blackPen=new Pen(Color.Black);
private SolidBrush _blackBrush= new SolidBrush(Color.Black);
private SolidBrush _redBrush= new SolidBrush(Color.Red);
private SolidBrush _blueBrush= new SolidBrush(Color.Blue);
private SolidBrush _greenBrush= new SolidBrush(Color.Green);
//Fonts used throughout the bar chart
private Font _stdFont = new Font("Tahoma", 8, FontStyle.Regular);
private Font _smallFont = new Font("Tahoma", 6, FontStyle.Regular);
private Font _boldFont = new Font("Tahoma", 8, FontStyle.Bold);
You will need to override the OnPaint() event for this usercontrol.
public void BarChart_Paint(object sender,
System.Windows.Forms.PaintEventArgs e)
{
LoadBarChart(e.Graphics);
}
public void BarChart_Resize(object sender, System.EventArgs e)
{
this.Refresh();
}
The LoadBarChart() method does the bulk of the drawing for the bar chart usercontrol.
private void LoadBarChart(Graphics Graphics)
{
int _counter;
//Calculate chart dimensions
_chartTop = _marginY;
_chartBottom = this.Height - _marginY;
_chartLeft = _marginX;
_chartRight = this.Width - _marginX;
_chartHeight = _chartBottom - _chartTop;
_chartWidth = _chartRight - _chartLeft;
_ValuePerChartPixel = (_HighestValue)/ _chartHeight;
//If no datasource was loaded, we display a message to //indicate that data is loading
if (_dataSource == null)
{
Graphics.DrawString("Loading data...", _stdFont,
_blackBrush, 15, 15);
return;
}
//Draw Chart title
Graphics.DrawString("Monthly sales ($M)", _boldFont,
_blackBrush, 2, 2);
//Draw Y axis
Graphics.DrawLine(_blackPen, _chartLeft, _chartTop,
_chartLeft, _chartBottom);
//Draw X axis
GDI+ chartbar chart, creatingGraphics.DrawLine(_blackPen, _chartLeft, _chartBottom,
_chartRight, _chartBottom);
//Draw Y axis labels
_counter = 0;
double _LabelValue;
while (_counter < _chartHeight)
{
//Draw the label hair
Graphics.DrawLine(_blackPen, _chartLeft - 3,
_chartBottom - _counter, _chartLeft - 1, _chartBottom
- _counter);
//Get the value at the label, and convert them to the correct base
_LabelValue = _ValuePerChartPixel * _counter;
_LabelValue = _LabelValue / _BaseOfValue;
//Draw the label
Graphics.DrawString(Strings.Format(_LabelValue, "#0.0"),
_smallFont, _blackBrush, 0, VAlignMiddle(_chartBottom
- _counter));
_counter = _counter + _YAxisLabelSpacing;
}
//Draw X axis labels
_XPixelsPerDay = (int) ((_chartWidth)/ 3);
int _x = _chartLeft;
int _YPos1;
string _monthName;
SolidBrush[] _bars = new SolidBrush[4];
//Initialize different colors for each bar
_bars[0] = _blueBrush;
_bars[1] = _greenBrush;
_bars[2] = _redBrush;
for (_counter = 0; _counter <= 2; _counter++)
{
//Draw the X-Axis hairs
Graphics.DrawLine(_blackPen, _x, _chartBottom + 1, _x,
_chartBottom + 6);
Graphics.DrawLine(_blackPen, _x + _XPixelsPerDay,
_chartBottom + 1, _x + _XPixelsPerDay, _chartBottom + 6);
//Draw X-Axis labels
_monthName = DateAndTime.MonthName(DateTime.Now.Month +
_counter - 2, true);
Graphics.DrawString(_monthName, _smallFont, _blackBrush,
_x + 5, _chartBottom + 6);
//Draw the data bars
_YPos1 = _chartBottom - ConvertValueToPixels((int)
(_DataValues[_counter]));
Graphics.FillRectangle(_bars[_counter], _x, _YPos1,
_XPixelsPerDay, ConvertValueToPixels((int)
(_DataValues[_counter])));
_x += _XPixelsPerDay;
}
}
//This method converts a sales amount into a Y coordinate on //the line chart
GDI+ chartbar chart, creatingprivate int ConvertValueToYCoordinate(int Value)
{
return _chartBottom - (int) ((Value)/ _ValuePerChartPixel);
}
//This method middle-aligns the Y-axis labels vertically
private int VAlignMiddle(int Y)
{
return Y - 5;
}
As with the other charts, you need to modify the LoadDashboard() method to load the bar chart usercontrol.
private BarChart _barChartControl;
private void LoadDashboard()
{
.
.
.
_barChartControl = new BarChart();
_barChartControl.Dock = DockStyle.Fill;
_barChartControl.Visible = true;
pnlBarChart.Controls.Add(_barChartControl);
}
As a last step, you will need to call the BeginInvoke() method to pass the<LastThreeMonthSales> XML node into the bar chart usercontrol.
private delegate void
PopulateBarChartControlDelegate(XmlElement Data);
private void BeginGetChartDataCallback(IAsyncResult Result)
{
.
.
.
//Look for the node of the last three month of sales and
//load it into the bar chart control
_xmlLastThreeMonthSales = (System.Xml.XmlElement)
(_xmlRoot.GetElementsByTagName ("LastThreeMonthSales")[0]);
PopulateBarChartControlDelegate _barchartDelegate = new
PopulateBarChartControlDelegate (PopulateBarChartControl);
this.BeginInvoke(_barchartDelegate, _xmlLastThreeMonthSales);
}
private void PopulateBarChartControl(XmlElement Data)
{
_barChartControl.Datasource = Data;
}
If you try running your application again, you will be able to see the bar chart rendered in the following fashion:
Now, try something different—try resizing the chart areas by dragging the splitters; all three charts will resize automatically (shown as follows):
You can additionally provide a manual refresh function to your end users so that clicking on the Refresh menu item will initiate a reconnection to the remote web service for the latest data.
public void mnuRefresh_Click(System.Object sender,System.EventArgs e)
{
RefreshAllCharts();
}