
The CLR Profiler tool is another powerful tool that allows you to view the memory allocation profile of your application. It provides the details of how your application is allocating and using managed objects. You can look at the heap at various points in time and even walk through the method calls involved in allocating each managed object.
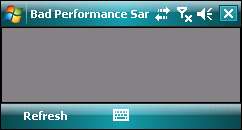
While the Remote Performance Monitor tool is useful in detecting memory leaks, the CLR Profiler tool allows you to zoom in on the particular method and line of code that caused it. To describe the features of the CLR Profiler tool, we will run it on another sample application—one with visibly bad performance.
Let's assume we have an application that needs to populate a DataGrid control with a list of Customer objects. Each Customer object holds a Product code (the product he or she is interested in), which is used to fetch the actual product name from a hash table.
Create a new project and add a new form to the project. Add a DataGrid control to the form and create a menu item with the caption Refresh.
Add a class named Product to the project. This class represents a product, and also contains the function to generate a lookup table of all available products.
class Product
{
private string _productName;
private string _productCode;
private byte[] _productImage = new byte[500];
public Product(string ProductName, string ProductCode)
{
_productName = ProductName;
_productCode = ProductCode;
}
public string ProductName
{
get { return _productName; }
set { _productName = value; }
}
public string ProductCode
{
get { return _productCode; }
set { _productCode = value; }
}
//Generate 20 sample products with the codes P1,P2,P3...
//and returns them as a hashtable
public static Hashtable LoadAllProducts()
{
Hashtable _products = new Hashtable();
for (int i = 0; i <20; i++)
{
Product _prod = new Product("Product" + i.ToString(),
"P" + i.ToString());
_products.Add(_prod.ProductCode, _prod);
}
return _products;
}
}
Add another class named Customer to the project. This class represents a customer. You will notice that the constructor for this class attempts to compare the specified ProductCode against the lookup table generated from the LoadAllProducts function.
class Customer
{
//Full name of the interested product
private string _interestedProduct;
//Customer name
private string _customerName;
public string InterestedProduct
{
get { return _interestedProduct; }
set { _interestedProduct = value; }
}
public string CustomerName
{
get { return _customerName; }
set { _customerName = value; }
}
public Customer(string CustName, string ProductCode)
{
Hashtable _allProducts = Product.LoadAllProducts();
Product _matchingProduct =
(Product)_allProducts[ProductCode];
_customerName = CustName;
_interestedProduct = _matchingProduct.ProductName;
}
}
In the form you've created earlier, write the following code. Upon loading the form, we will allocate about 50 KB of memory. The reasons for this will be clear in the next section. The Datagrid is populated with 20 customer objects when the user clicks the Refresh menu item.
public partial class frmBadPerformanceSample : Form
{
byte[] _workBuffer;
private void RefreshPage()
{
List<Customer> _allCustomers= new List<Customer>();
for (int i = 0; i < 20; i++)
{
Customer _cust = new Customer("Cust" + i.ToString (),
"P" + i.ToString ());
_allCustomers.Add(_cust);
}
dgCustomers.DataSource = _allCustomers;
}
private void DoSomeIntensiveWork()
{
//Allocate some byte[] memory
_workBuffer = new byte[50000];
//Do something here
//...
}
private void frmBadPerformanceSample_Load(object sender,
EventArgs e)
{
DoSomeIntensiveWork();
}
private void mnuRefresh_Click(object sender, EventArgs e)
{
RefreshPage();
}
}
The loading of all 20 sample products was placed in the constructor of the Customer object to intentionally simulate bad performance. So for 20 customer records, there would be 20 * 20 = 400 product objects allocated in memory. You will now use the CLR Profiler tool to see if you can get to the root of the problem.
Compile and deploy the sample project above to your mobile device/emulator. You can launch the .NET CF CLR Profiler tool from the Start | All Programs | .NET Compact Framework Power Toys 3.5 menu. You will immediately see the CLR Profiler control panel, similar to the following screenshot:
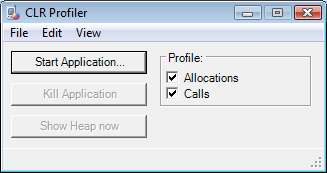
Click on the Start Application... button, and type in the full path to your Bad Performance sample application (as it exists on your mobile device). You can leave the Parameters field blank as there aren't any. Click on the Connect button to start recording information. The mobile application will run.
Ensure that you wait a few seconds after the form has loaded, then click the Refresh menu item. A few seconds later, the Datagrid will be populated with data. After that click the Kill Application button in the CLR Profiler control panel to stop the recording. You will see the following window appear:
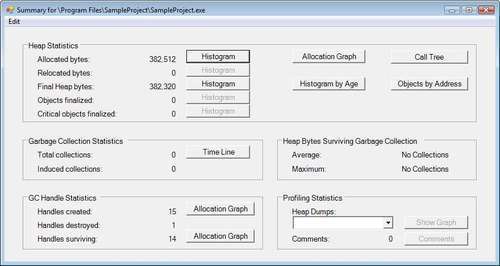
From this window, you can launch a number of different views of the collected statistics. The first you will look at is the Histogram view. Click on the Histogram button next to the Allocated bytes field. A window similar to the one shown as follows will appear. This window shows you the amount of memory allocated for each different type of managed object used in your application. You can also fine-tune the chart to see more or less detail by changing the vertical and horizontal scales.
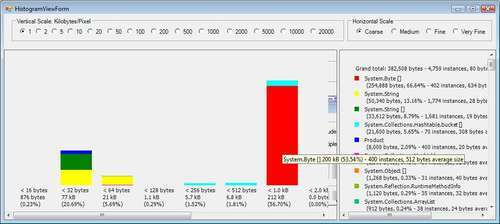
The first thing you will notice is that a surprisingly large amount of Byte objects were allocated (212 Kb). This tells you immediately that something isn't right, considering that all that your application is doing is just populating a Datagrid.
Note
You can use the Histogram view to find out (at first glance) if there is anything "unusual" about the proportion of allocated objects.
Now that you're on to something—the Byte object—let's take a look at the allocation history of this object. Close the Histogram view, and click on the Allocation Graph button in the main window.
The Allocation Graph is a visual walkthrough of your entire application from the main thread all the way down to each individual method call along with its allocated objects. The physical size of each item indicates the amount of memory it takes up.
Even for a simple application, it might look really messy when it first loads up, but you can change the level of detail to show only allocations of a significant size. You can also quickly locate an item by navigating to the Edit | Find routine menu. You can use this to look for the Byte object.
When you've found the Byte object, you will notice that two methods contribute to its allocation (as highlighted in the following screenshot):
- The constructor of the
Productclass - The
DoSomeIntensiveWorkmethod
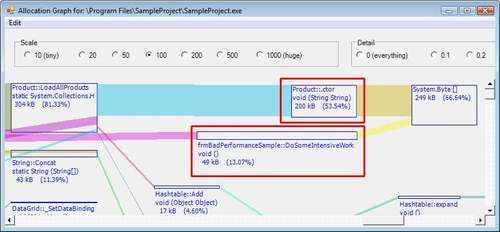
By looking at this chart, you can further conclude that the constructor of the Product class was called in the LoadAllProducts method.
You now know that two methods contribute to the unusual allocation of the Byte object. Usually, with some guesswork, that is good enough for you to know which method caused the problem. In the lifetime of a complex application, however, you will usually have much more than two leads and you may need to zoom down in further detail.
The Time Line view allows you to view the GC heap over a time scale representing the duration of your application's execution. With this feature, you can inspect the allocation graph at any point (in time) in its execution! Close the Allocation Graph view and click the Timeline button on the main CLR Profiler Tool window. The following screenshot shows the Time Line view:
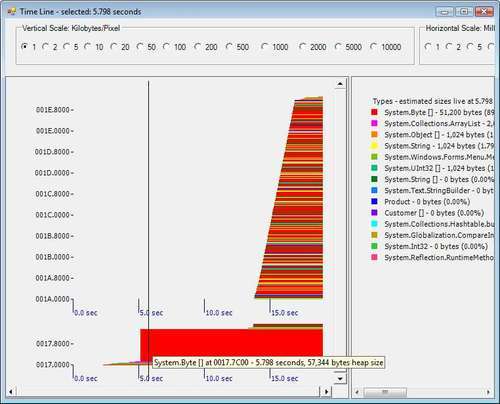
Now, move the time window to the first few seconds (when you haven't yet clicked the Refresh button to populate the Datagrid) by left-clicking any area within the first few seconds in the chart. A thin vertical line will appear denoting the currently selected time window. Right-click on the chart and choose Show Who Allocated.
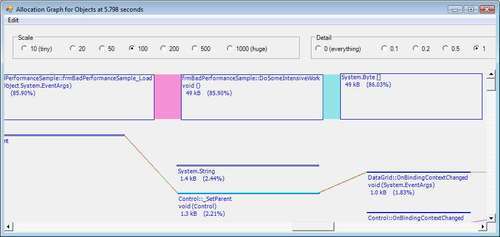
The familiar Allocation Graph will appear again, but this time, it will only show the objects allocated during that point in time. If you look for the Byte object again, you can see it was allocated solely by the DoSomeIntensiveWork method (shown next).
Now, close the allocation graph and move the time window to a later point in time (after you have clicked the Refresh button to populate the Datagrid). If you look at the allocation graph in that time window, you will be able to see the Product object's constructor contributing to the allocation of the Byte object (shown next).
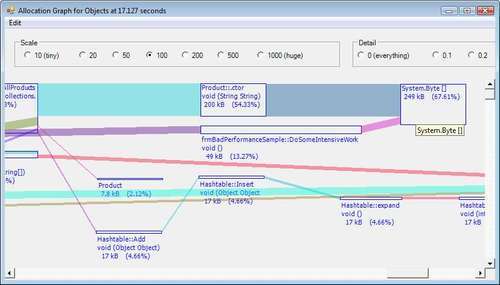
As the Product object is only created when you click the Refresh button to populate the Datagrid, it doesn't show up in the allocation graph before that. We can also conclude from this view that the problem lies in the Product object's constructor rather than the DoSomeIntensiveWork method, because the bad performance was observed only when you clicked the Refresh button.
Knowing that the Product object's constructor is the culprit might not be enough—if you've gone to look at the source code of the constructor, you'll find that each Product allocates 500 bytes to store an image, but you already knew that. You need to know how 20 products can give rise to an allocation of 212,000 bytes.
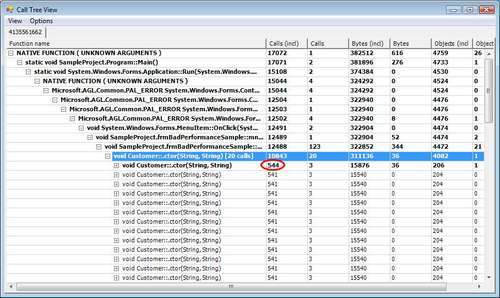
The Call Tree view is another view that shows every allocation made by every method call in your application (in a tree-list format). Click the Call Tree button in the main CLR Profiler Tool window. A new window will open, and you will see a single item in the tree list. This represents the main function thread of your application. Method calls are shown in black, and object allocations are shown in green.
Note
You can follow the trail of execution by expanding each node. At each level, there will be a highlighted node. The highlighted node shows the method that allocated the most memory at that level. By walking through this trail of highlighted nodes, you will eventually end up at the object you are looking for.
At one point as you are expanding the nodes, you will arrive at a rather strange observation. Twenty Customer objects are generated, but each object makes roughly 500 method calls, and the size of each Customer object comes up to about 15 KB in size, which is alarmingly huge. This is shown in the following screenshot:
If you expand each Customer object further, you finally find the root cause of the problem—the constructor of each Customer object makes a call to the LoadAllProducts method, which generates 20 Product objects in return. This makes a total of 400 Product objects!
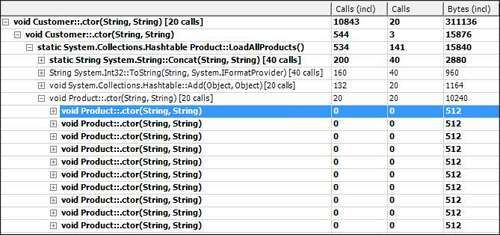
From this point, you can conclude that the next logical step is to move the LoadAllProducts method out of the constructor of the Customer class into a global area so that it is only called once—resolving the bad performance problem.
Tip
The CLR Profiler is way too slow!
You might have noticed that the CLR Profiler generates a huge amount of data—even from a simple application. I've heard developers complain that a reasonably complex application started with the CLR Profiler can take minutes to load up.
There is a workaround to this, which is to use the CLR Profiler API, a set of libraries that allow you to specifically control when to generate diagnostic data programmatically from within your application. This topic is out of the scope of this book.