
The .NET CF Remote Performance Monitor and GC Heap Viewer tool, as its name suggests, consist of two parts:
- The Remote Performance Monitor, which allows you to view application statistics (such as the amount of memory allocated and so on) in real time. It is also able to project these statistics to the Windows PerfMon tool so that the data can be viewed as a real-time graph.
- The GC Heap Viewer tool, which allows you to capture snapshots of the GC heap area (the memory area where managed objects are allocated) at certain times and then analyze their differences.
Before we proceed to use this tool, it is appropriate to understand why you will need it in the first place. One of the main reasons is memory leaks—a condition where memory allocated is not released after use. In the next section, we will take a look at how memory leaks can arise as a result of careless programming.
Many developers still think that memory leak issues are only "real" or significant problems in multiuser environments such as web applications where leaks build up over a large number of requests, and that it is less of a concern for single-user applications. On the contrary, mobile applications suffer more when memory leaks occur, due to the lesser amount of memory present on the device, and the likely possibility that applications are kept open for long periods of time.
Although the .NET CF's garbage collector does a good job cleaning up managed objects that gone out of scope, certain programming mistakes can cause these objects to remain referenced in memory, and thus go uncollected. The following are some mistakes commonly encountered:
- Registering for events and forgetting to unregister them after you're done:
This is by far the most common source of memory leaks for the C# developer. Any event handlers (and their objects) registered with an event are not released until they are unregistered from the event.
- Forgetting to invoke the Dispose method:
Many controls and classes have
Disposemethods. For example, theOleDBCommandandODBCCommandobjects haveDisposemethods that must be called to free up unmanaged resources. - Using static references:
When you add objects to an array declared as a static variable, for example, these objects (and all other objects it references) are kept alive until the static array itself is destroyed.
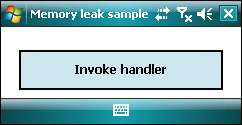
To effectively demonstrate the tools in this section, you will need to create a small application that intentionally causes a memory leak by instantiating a class, registering it as an event handler, and failing to unregister it after use.
Create a new project, add a new form to the project, and place a single button on the form.
In the click event of the button, we want to instantiate a business object, register one of its methods as an event handler and then raise the event. Most developers would write something similar to the following code:
// Declare the delegates
public delegate void OnCertainEventOccured(object
sender, EventArgs e);
public event OnCertainEventOccured OnCertainEvent;
// The Click event of the button on the form
private void btnInvokeHandler_Click(object sender, EventArgs e)
{
//Register the event handler
MyLargeBusinessObject _bizObj = new
MyLargeBusinessObject();
this.OnCertainEvent += new
OnCertainEventOccured(_bizObj.TheEventHandler);
//Call the event handler
OnCertainEvent(this, null);
//Kill the business object
_bizObj = null;
}
The definition of the business object follows:
//A large business object
class MyLargeBusinessObject
{
//Let's assume this business object allocates a large
//amount of memory space
char[] _bigVariable = new char[100000];
//The event handler in the business object
public void TheEventHandler(object sender, EventArgs e)
{
//Do something here...
}
}
The (incorrect) perception is that the _bizObj instance would automatically go out of scope once the method completes (as it was declared inside the method). To be safe, you might even decide to enforce a _bizObj = null at the end of the method.
You will find that despite your efforts, _bizObj remains uncollected by the garbage collector. This is because there is still one item that holds a reference to the _bizObj object—the event registration itself. To ensure that there are no references left, you must unregister the event handler in _bizObj from the event at the end of the method.
Nevertheless, let's try subjecting the preceding code sample through the Remote Performance Monitor. Create the sample project, name it as SampleProject, and deploy it to your mobile device/emulator.
Before you can use the .NET CF Remote Performance Monitor tool, you must first ensure that you have set up an ActiveSync connection between the mobile device/emulator and your development PC.
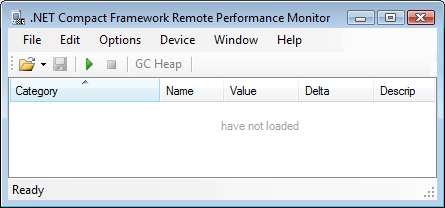
After doing so, you can launch the Remote Performance Monitor tool from Start | All Programs | .NET Compact Framework Power Toys 3.5 on your development machine. You will encounter a window similar to the one shown in the following screenshot:
Click on the Launch Application button (represented by the green arrow icon). This will allow you to specify the application that you want to monitor (shown in the next screenshot). Choose the appropriate device and type in the full path to your application (as it exists on the mobile device). Ensure that the SampleProject.exe application is already deployed to the mobile device/emulator, but don't launch the application yet. You can leave the other fields empty.

When you click the OK button, the Remote Performance Monitor tool will launch the application on your device and, at the same time, start collecting statistics immediately. You will see a window similar to the one shown in the next screenshot. A number of counters are displayed, with a description of each one on the right.
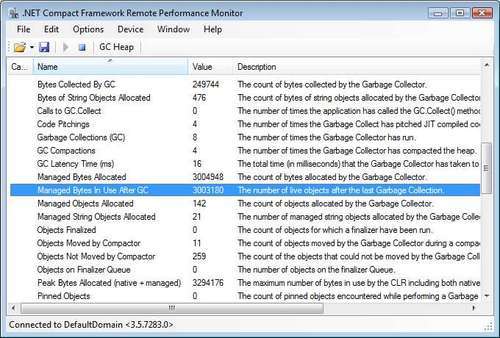
Most of the counters relevant to memory management are displayed under the GC category.
Note
The Managed Bytes In Use After GC counter is a good indicator of whether a memory leak has occurred. This counter shows the number of live objects remaining since the last collection run by the Garbage Collector. If this number keeps increasing over time, it is a good chance that there is a memory leak somewhere preventing your managed objects from being collected by the Garbage Collector.
You will probably notice that the Managed Bytes In Use After GC counter is initially set to 0. Now, try clicking the Invoke button in the SampleProject application window. You will notice the value in the Managed Bytes Allocated counter increase, indicating that memory was allocated (due to the instantiation of the MyLargeBusinessObject class).
Click on the same button a few more times. Eventually, a GC run will occur, and you will realize that the Managed Bytes In Use After GC counter will show a number greater than 0. Clicking the button further will increase this value. This indicates that the objects created from the button click action are not being collected by the GC run.
The Remote Performance Monitor tool can also output its data (in real time) to the Windows PerfMon tool so that you can see the generated data in a scrolling time graph. To do this, you first need to ensure that the Publish to PerfMon setting under the Options menu is ticked.
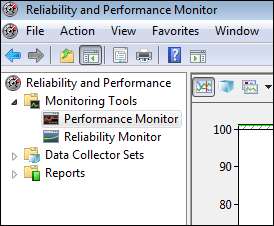
Launch the PerfMon tool by navigating to Start | Control Panel | Administrative Tools | Reliability and Performance Monitor. Select the Performance Monitor item under the Monitoring Tools item category in the left pane.
A time chart will be seen instantly in the right pane. You now need to add the .NET CF counters to the chart so that they can be displayed. Right-click on the right pane and choose Add Counters. You will see a window similar to the following screenshot:
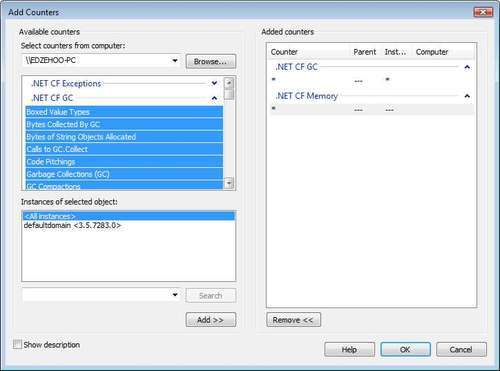
Look for the .NET CF GC category, expand the list, select the counters you wish to include in the chart display, and click the Add >> button to include it in the list. When you are done, click the OK button. You will see the counters appear in the chart (as shown in the following screenshot).
Note
Take note that you might need to adjust the vertical scale of the chart appropriately to properly view the data in all the counters. You can set the vertical scale by navigating to Action | Properties, clicking on the Graph tab in the window that pops up, and changing the Maximum and Minimum values under the Vertical Scale section.
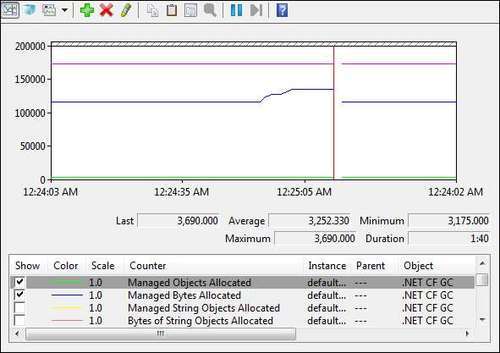
If you have the Managed Bytes In Use After GC counter added, you can see how the chart responds by clicking the Invoke button on your SampleProject form a few times.
Another way to detect memory leaks is via the GC Heap Viewer tool. In the Remote Performance Monitor tool, click the GC Heap button. This will generate a snapshot of the heap (at the time when you pressed the button). You will see the display shown in the following screenshot.
The GC Heap Viewer shows you a list of all the managed objects that were allocated. If you look for the SampleProject.MyLargeBusinessObject class, you will notice that there are multiple instances of it allocated in memory. This is because each time you pressed the Invoke button on your form, a new instance of the class was generated. The objects are not released from memory because they were not properly unregistered from the OnCertainEvent event.

Try clicking the Invoke button on your SampleProject form once. Now, without closing the current heap window, navigate to the main tool window, and click the GC Heap button one more time. This will capture a second snapshot of the heap. You will notice in this latest snapshot that the number of SampleProject.MyLargeBusinessObject instances have increased by 1.
Now, do the same thing as above one more time so that you now have three GC Heap View windows open. In any one of the GC Heap View windows, navigate to the View | Compare Heap menu item. This will compare the heaps across all open GC Heap View windows. You will see a snapshot similar to the following screenshot:
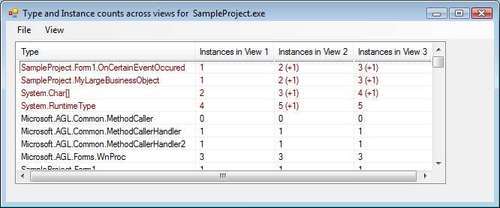
This comparison view shows you the delta (of the number of instances) for each managed object between each GC snapshot. You can see that the number of instances of the SampleProject.MyLargeBusinessObject object has increased by one across each snapshot.
Now that we know for sure that there's a memory leak in SampleProject, let's resolve the leak. Add the following highlighted line of code to unregister the _bizObj object from the event.
private void btnInvokeHandler_Click(object sender, EventArgs e)
{
//Register the event handler
MyLargeBusinessObject _bizObj = new
MyLargeBusinessObject();
this.OnCertainEvent += new
OnCertainEventOccured(_bizObj.TheEventHandler);
//Call the event handler
OnCertainEvent(this, null);
//Unregister the event handler
this.OnCertainEvent -= new
OnCertainEventOccured(_bizObj.TheEventHandler);
}
Now, compile and deploy the application to the mobile device. Launch the application from the Remote Performance Monitor tool again. You will notice that clicking the Invoke button now no longer causes the value in the Managed Bytes In Use After GC counter to rise. If you try capturing a GC snapshot, you will not even see the SampleProject.MyLargeBusinessObject object in the list anymore, because the object goes out of scope as soon as the method completes. If you run it through the same test as earlier, and do a comparison across the various GC snapshots, you will see the message shown in the following screenshot:
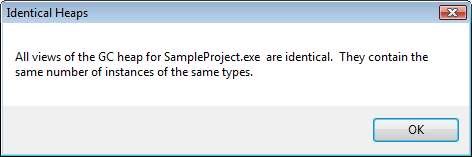
This confirms that there are no more objects left unallocated—the memory leak is resolved.