Most of us have encountered cases where an application would crash and burn after running for extended periods of time and then see error messages (such as Out of handles exceptions) that don't seem to shed any light on where or how the problem occurred. Troubleshooting issues such as memory leaks using the debugging features of Visual Studio alone can be a frustratingly difficult affair, particularly because these types of problems cannot be traced by the debugger to any specific line in code but rather, arise from a build-up of memory that is not released.
Microsoft has released a suite of diagnostic tools to help .NET CF developers troubleshoot these types of issues in their applications. The Power Toys for .NET CF 3.5 suite is provided free of charge, and gives you the ability to peek "under the .NET CF hood" while your mobile application runs. In this chapter, you will learn how to use each tool to resolve commonly encountered .NET CF problems. You will specifically learn about the following:
- The Power Toys for .NET CF 3.5 package and what it contains
- How to use the Remote Performance Monitor and GC Heap Viewer tools to detect and resolve memory leaks
- How to use the CLR Profiler tool to investigate the memory allocation profile of your application
- How to use the App Configuration tool to configure the specific .NET CF version used for an application
- How to use the ServiceModel Metadata tool to generate client code to connect to WCF or web services
- How to log and view network events using the Remote Logging Configuration/Viewer Tools
In a nutshell, the Power Toys for .NET CF 3.5 package is a set of tools commonly used to gauge application performance and collect diagnostic information for applications developed on .NET CF 3.5. The following table lists down each tool in the package and what it does.
|
Tool name |
Description |
|---|---|
|
Remote Performance Monitor and GC Heap Viewer |
The Remote Performance Monitor allows you to capture and view performance statistics in real time while your mobile application is running. The GC Heap Viewer allows you to capture "snapshots" of the memory heap at different points in time and to analyze the differences between each "snapshot." |
|
CLR Profiler |
The CLR Profiler tool is a memory profiler that provides details on how your application allocates managed objects. |
|
App Configuration tool |
This relatively simple tool allows you to view the contents of the Global Assembly Cache (GAC) on your mobile device. It also allows you to configure the specific .NET CF version used for each application on the mobile device. |
|
ServiceModel Metadata tool |
This tool allows you to generate client-side source code (in the language of your choice) to connect to a WCF or web service. You can immediately import these generated files into your Visual Studio project. |
|
Remote Logging Configuration tool |
This tool allows you to enable or disable logging of network events on the mobile device. Once enabled, all network messages and events (including WCF sessions) will be captured to a log file on the mobile device. |
|
Network Logging Viewer tool |
This tool allows you to view the log files generated by the Remote Logging Configuration tool. |
You can download the Power Toys for .NET CF 3.5 package from this location:
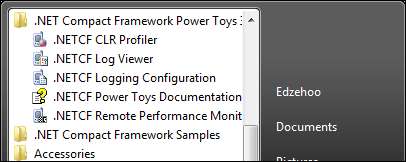
After running the setup, you will see a new shortcut in your All Programs area (as shown in the following screenshot). Some of the tools mentioned in the preceding table might not be visible in this area because they are command-line based. Nevertheless, you will see how you can launch and use each of these tools later in this chapter.