
Our second application, the mobile dashboard, will be used by executive-level decision makers in Tomorrow Inc. on the move. The mobile dashboard will need to pull real-time data off the server over an Internet connection, which is then collated and presented on the dashboard in the form of a graphical chart. New data is periodically pulled down from the server every minute to refresh the chart displays.
You can see how a smart client model would probably work best in this scenario; a smart client allows you to render the charts you need on the device while keeping data on a remote server. The real-time nature of the data received will also ensure that your charts always display the latest information.
With "on the move" scenarios, you can probably expect Internet service to be choppy or simply not available in some areas during travel. We will therefore use stateless web service calls to the remote server to access data in real time. Using stateless connections in our application allows our dashboard to resume from where it left off after an Internet service disruption without having to request the user to perform any additional action (such as a re-login). The mobile dashboard service will appear seamless to the end user.
Note
A stateless web service call is a web service call that does not maintain any state information in between calls.
Web service calls are also, by default, blocking (synchronous) calls. What this means is that when a call is made to the server to retrieve data, your application will ignore all user input until the data is returned. This is certainly not acceptable, especially on a smart client!
In Chapter 10, Building the Dashboard, when we build the dashboard, we will explore how we can make use of the multithreading features of the .NET Compact Framework to create asynchronous web service calls.
The planned dashboard design will look roughly similar to the following screenshot:
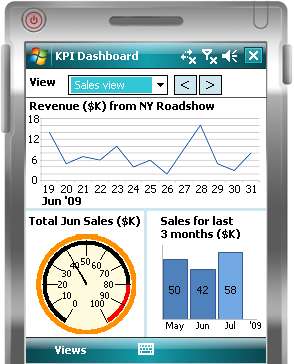
You will create the following charts in this application:
This line chart sums up the total revenue collected from the road shows on a daily basis. The process of building this chart will introduce the basic drawing tools in the GDI + API that you can use in your application for visual data display.