
The saying that "a picture is worth a thousand words" is especially true in business communications, when you need to clearly explain facts or concepts, particularly to an increasingly global audience. Several programs in the 2007 Office system include a new feature called SmartArt. This tool is very useful for creating professional business graphics within documents, spreadsheets, presentations, and messages. You can easily create lists and diagrams depicting relationships, processes, cycles, and hierarchies and so on in your e-mail messages. When sending a message, Outlook converts any SmartArt graphics within the message to static graphics.
In this exercise, you will create a SmartArt diagram within an e-mail message. There are no practice files for this exercise.
Maximize the message window, and then click to position the insertion point in the content pane.
On the Insert tab, in the Illustrations group, click the SmartArt button.
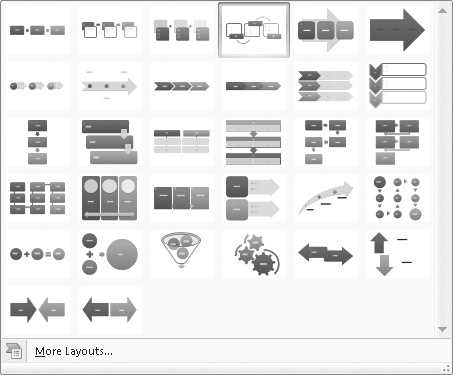
The Choose A SmartArt Graphic dialog box opens, displaying the many types of graphics available. You can view the graphic types by category by clicking the category names in the left pane, and preview an individual graphic type by clicking it in the center pane.
Scroll the center pane of the dialog box for an overview of the available SmartArt graphics. You can display the name of a graphic by pointing to it.
In the left pane, click Process, and then in the center pane, click the last icon in the top row (Alternating Flow).
A preview of the selected SmartArt graphic appears in the right pane. This is a process diagram showing the details of a three-step process.
In the Choose a Smart Art Graphic dialog box, click OK.
Outlook inserts the selected process diagram in the content pane. It looks similar to the preview graphic, but without the colors and three-dimensional aspects. (You select formatting options later.) The SmartArt Tools contextual tabs, Design and Format, appear on the Ribbon.
Click the Text Pane tab on the left side of the diagram.
Tip
You can display or hide the Text Pane for any SmartArt diagram by clicking the diagram and then clicking the Text Pane button in the Create Graphic group on the Design contextual tab, or by clicking the Text Pane tab on the left side of the diagram drawing area.
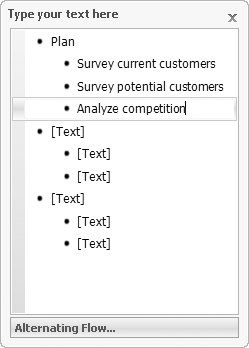
The Text Pane appears, clearly illustrating the hierarchy of the text contained in the diagram.
You can enter text in the Text Pane or directly in the diagram—selecting a diagram element or positioning the insertion point within the bulleted list also selects the corresponding element in the diagram or Text Pane. The diagram type appears at the bottom of the Text Pane; pointing to it displays a ScreenTip describing the purpose of the selected type of diagram.
In the Text Pane, click the [Text] placeholder to the right of the first bullet, and then type Plan.
As you type in the pane, the text appears in the diagram.
Click the [Text] placeholder to the right of the first second-level bullet, and type Survey current customers. Press the
 key to move to the next second-level bullet, and then type Survey potential customers.
The font size in the diagram adjusts to fit the available space.
Press
 to create another second-level bullet in the Text Pane and in the diagram, and then type Analyze competition.
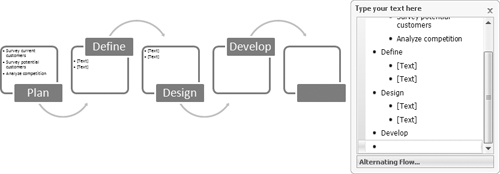
In the diagram, click the second solid blue box to select the placeholder, and then type Define.
As you type, the text also appears in the second first-level bullet in the Text Pane.
In the third solid blue box, type Design.
On the Design contextual tab, in the Create Graphic group, click the Add Shape arrow (not the button), and then in the list, click Add Shape After.
An additional item appears at the right end of the diagram and in the Text Pane. You can add shapes above, below, before, or after the selected shape, depending on the diagram layout.
In the new solid blue box, type Develop.
In the Text Pane, click at the end of the word Develop, and then press
.A first-level bullet and additional shape appear.
Type Test, and then in the Text Pane, click the Close button.
At its current size, the text within the diagram is very difficult to read.
Point to the move handle on the right side of the diagram until the pointer becomes a double-headed arrow. Drag the move handle to the right to fill the message window.
In the Layouts group, click the More button.
In the Layouts gallery, point to a few of the diagram layouts to display live previews. Then click the fifth icon in the first row (Continuous Block Process).
The process diagram layout changes but the contents remain the same.
In the SmartArt Styles group, click the More button.
In the SmartArt Styles gallery, point to a few of the diagram styles to display live previews. Then under 3-D, click the first icon (Polished).
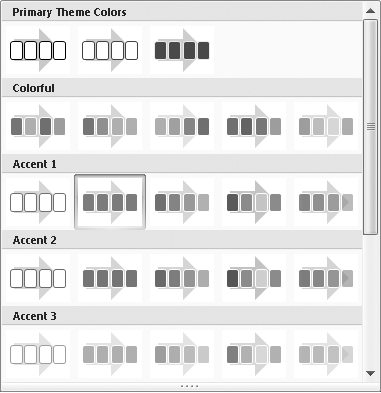
In the SmartArt Styles group, click the Change Colors button.
The color schemes displayed in the Colors gallery are variations of the current theme, and are organized in groups reflecting the six thematic accent colors. Changing the theme also changes the color schemes in the gallery.
Point to a few of the diagram styles to display live previews. Then under Colorful, click the second icon (Colorful Range – Accent Colors 2 to 3).
Enter your own e-mail address in the To box, and type SBS Development Cycle in the Subject box.
Send the message, and then display your Inbox.
When you receive the message, the diagram is visible in the Reading Pane. Open the message, and click the diagram.
The diagram is no longer an active SmartArt graphic; it has been converted to a static image. If you open the message from your Sent Items folder, you will find that the same is true of the diagram in that message.


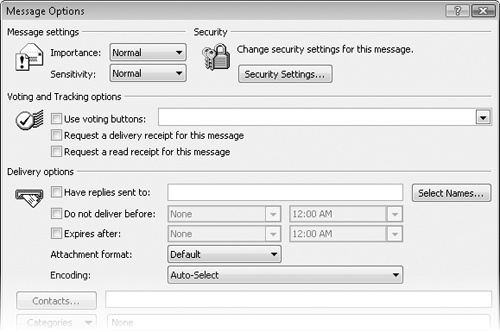
Changing Message Settings and Delivery Options
When sending a message, you can optionally include visual indicators of the importance, sensitivity, or subject category of a message, restrict other people from changing or forwarding message content, provide a simple feedback mechanism in the form of voting buttons, and specify message delivery options to fit your needs.
Common message settings and delivery options include:
Importance. You can indicate the urgency of a message by setting its importance to High or Low. A corresponding banner appears in the message header and, if the Importance field is included in the view, an importance icon appears in the Inbox or other message folder..
You can easily sort and group messages based on importance by clicking Importance in the Arranged By list.
Sensitivity. You can indicate that a message should be kept private by setting its sensitivity to Confidential, Personal, or Private). No indicator appears in the message folder, but a banner appears in the message header to indicate a sensitivity other than Normal. You can choose to include the sensitivity as one of the message attributes shown in the Inbox pane, but if you do, it replaces the message subject, which isn’t very helpful.
Security. If you have a digital ID, you can digitally sign the message; or you can encrypt the contents of the message.
Voting options. If you and your message recipients have Exchange Server accounts, you can add voting buttons to your messages to enable recipients to quickly select from multiple-choice response options.
Tracking options. You can track messages by requesting delivery receipts and read receipts. These receipts are messages automatically generated by the recipient’s e-mail server when it delivers the message to the recipient and when the recipient reads the message.
Categories. You can assign a message to a color category that will be visible to the recipient if he or she views the message in Outlook.

The most commonly used options are available in the Options group on the Message tab of the message window. You can access other options from the Message Options dialog box, which you open by clicking the Dialog Box Launcher in the lower-right corner of the Options group.
You can limit the actions other people can take with messages they receive from you by restricting the message permissions. For example, you can prevent recipients from forwarding or printing the message, copying the message content, or changing the content when they forward or reply to the message. (Restrictions apply also to message attachments.) Within a message window, permission options are available both on the Office menu and in the Options group on the Message tab.