
Repeat: Linking Categorical Variables Together
We use ”contingency tables” to link two or more categorical variables together.
For instance, in the Accu-Phi case study you may wish to associate license and size.
This analysis would tell you the number and percentage of premium versus freeware
users in different size bands of customer. Figure 15.2 Crosstab example of relating two categorical variables shows an example of this analysis, which is widely called “crosstabs.”
Figure 15.2 Crosstab example of relating two categorical variables
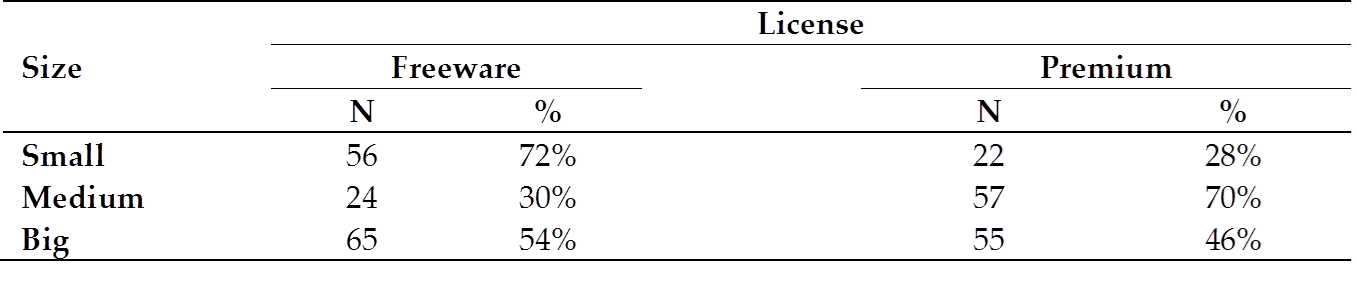
In contingency tables, each unique combination of categories is called a “cell.” For
instance, the combination of Small and Freeware customers would be a cell.
SAS generates contingency tables using the PROC FREQ procedure. To see an example
of a contingency table in our data, in which we want to link the ordinal variable
Size to the categorical variable License, open and run the file “Code08c Categ association
crosstabs.” You will get tables and charts comparing and associating the categories,
like Figure 15.2 Crosstab example of relating two categorical variables above, although with a little more detail.
Last updated: April 18, 2017
..................Content has been hidden....................
You can't read the all page of ebook, please click here login for view all page.