
Current Research Needs of the Company
The Company’s Current Research Project
Introduction to the Company’s Project
In the book, we will focus on one major research project for Accu-Phi. Accu-Phi has
now been selling services to the pilot group for over a year. Some 279 customers have
bought services from the pilot territory. Among this group, you are interested in
explaining and even predicting first year services sales in dollars, largely because
as a business you want to maximize sales.
Based on your studies or business background, you have used theory and experience
to choose other things that you think might explain, predict or at least associate
with sales. The next sections discuss these.
Other Variables that Explain, Predict or Associate with Sales
We also have data on the following:
-
License - is a description of what license the customer has, where the data would either be “Freeware” or “Premium.” You believe that premium software customers should buy more services.
-
Size - is a description of the size of the customer by turnover. You categorize this description into three broad levels, namely “Small,” “Medium,” or “Big” based on certain thresholds. Your initial belief is that bigger customers will buy more services.
-
Trust - refers to the trust the customer has in your product and company. You have measured trust through four questions in an online survey that you sent to the key account holder at the client. Various areas of management theory, past research and your experience suggests greater trust may lead to greater sales, all else being equal.
-
Customer satisfaction - is also seen as important, and is also a core concept in previous theories and studies. You also measure satisfaction through four questions in a paper-based customer survey. Again, various areas of theory, research and your experience suggests greater satisfaction may lead to greater sales, all else being equal.
-
Enquiries refers to the average number of enquiries about the core software product logged with the call center or online help by customers, per month, since starting use of the product. This data is provided by your in-house customer relationship management (CRM) data system. You believe that more enquiries may associate with higher sales, because customers who make more queries are more engaged with the software and perhaps more needful of consulting and/or training to help them with their requirements.
Figure 1.1 First lines of initial dataset shows the first twenty rows of an initial dataset, as it might appear in a data sheet
(we will use this data in SAS analyses throughout the book). Here, we have limited
the data to customers who have bought services.
Figure 1.1 First lines of initial dataset

Notes: This table is not all the data: I have omitted most of the Trust and Satisfaction
variables to enable the table to fit the page. You will see the whole dataset when
we open the SAS data file later in the text. Note also that there are mistakes in
the data that we will detect and clean later.
Because sales is your key focus in this study, these other variables will mostly be
seen as issues that can help explain or predict sales.
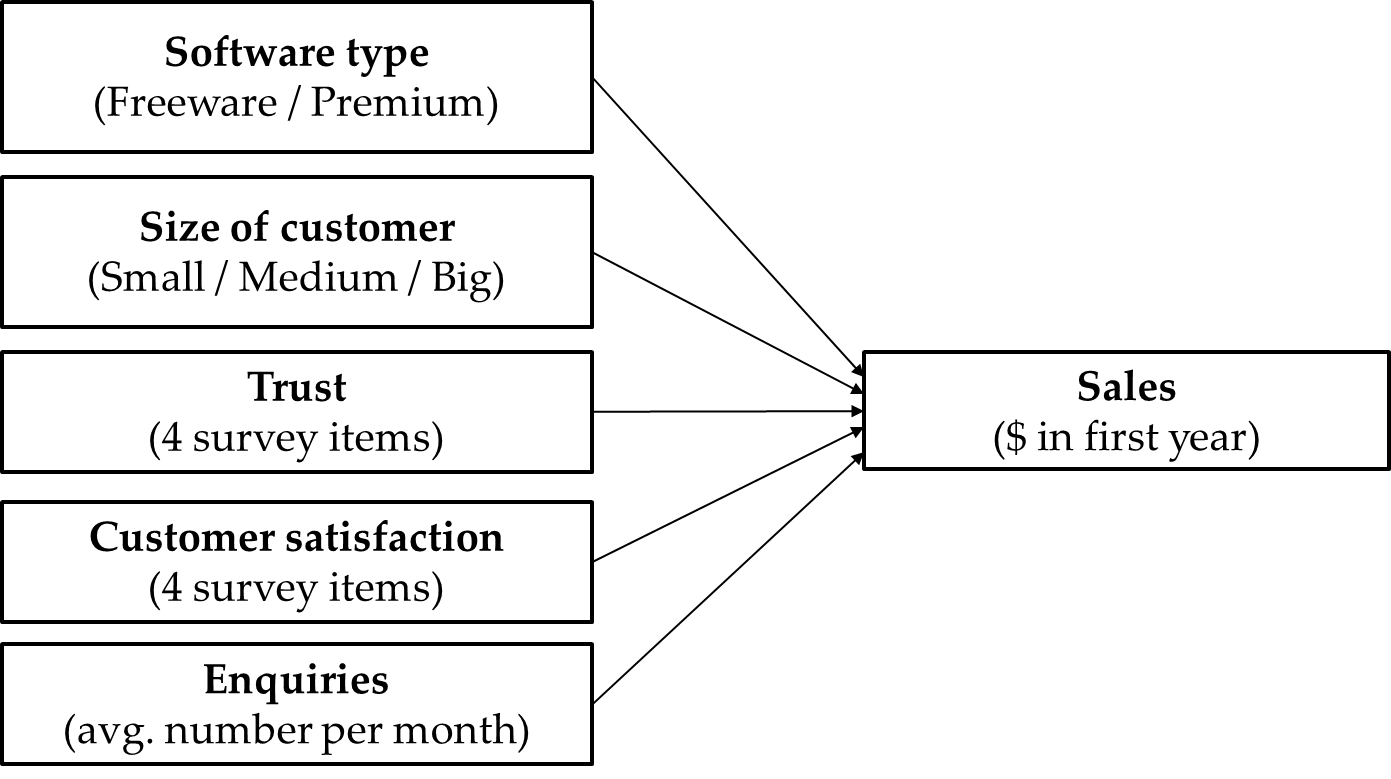
Figure 1.2 The variables in the case study explaining/predicting sales shows a simple model in which all other explanatory variables mentioned above explain
or predict sales.
Figure 1.2 The variables in the case study explaining/predicting sales
There are other issues that the case will consider, such as:
-
Analyzing the customer base by types of licenses and sizes
-
Relating the other variables (for instance, does higher satisfaction lead to higher trust?)
-
Focusing on differences in core variables (like sales) between sizes and licenses.
Last updated: April 18, 2017
..................Content has been hidden....................
You can't read the all page of ebook, please click here login for view all page.