
End Outcome of a Descriptive Statistics Analysis
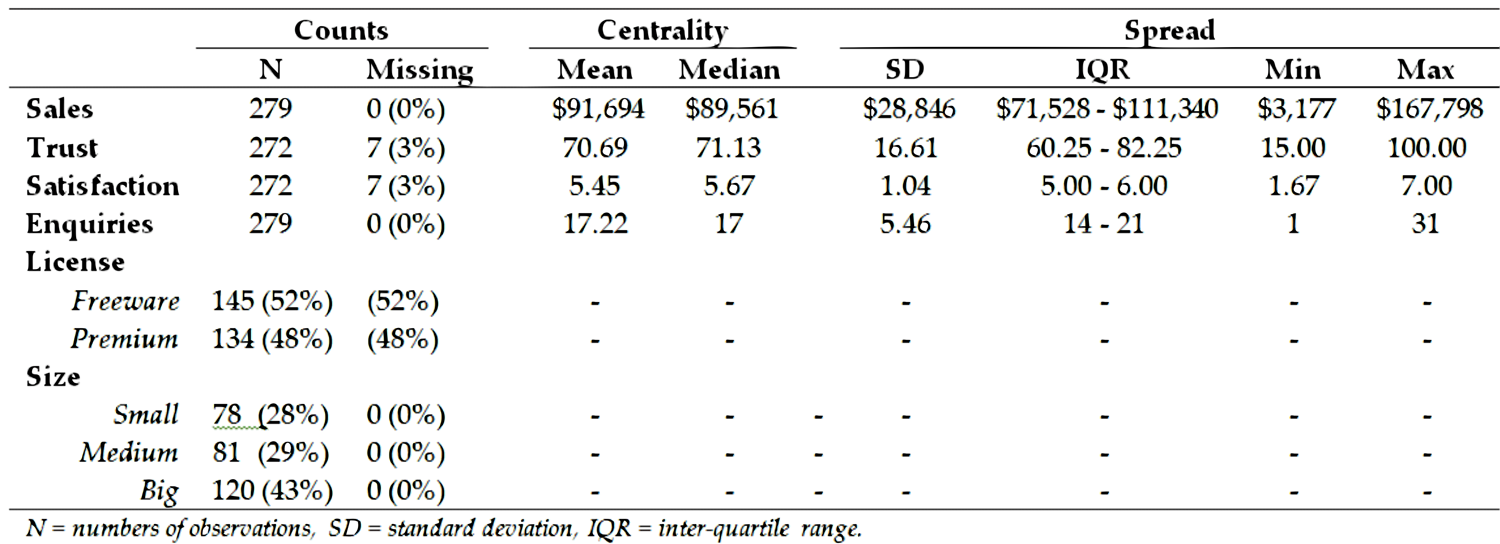
In descriptive statistics you want to end up with a table as shown in Figure 7.1 Example of a final descriptive statistics table, which expresses the major summary statistics for each major variable about which
you care, notably – as discussed in Chapter 3 – numbers of observation and missing data counts, central tendency statistics of choice (mean and median are the most common) and variable distribution statistics (measures of spread such as standard deviation and inter-quartile range
are most common, but other distributional issues can be explored, such as whether
the variable is normally distributed in a bell curve). After this, we explore each
of these in greater detail.
Figure 7.1 Example of a final descriptive statistics table
Various different projects may need different versions of such an analysis. In addition,
as will be seen, we can generate various plots of variables.
Last updated: April 18, 2017
..................Content has been hidden....................
You can't read the all page of ebook, please click here login for view all page.