
Multiple Plots Simultaneously through PROC SGPANEL
PROC
SGPLOT develops one plot at a time, but PROC SGPANEL allows you to
create and display multiple plots together. For example, Figure 10.7 Sales versus Enquiries split by License below shows
such a graph where the scatterplot relationship between Sales and
Enquiries is displayed separately by the two types of Licenses.
Figure 10.7 Sales versus Enquiries split by License
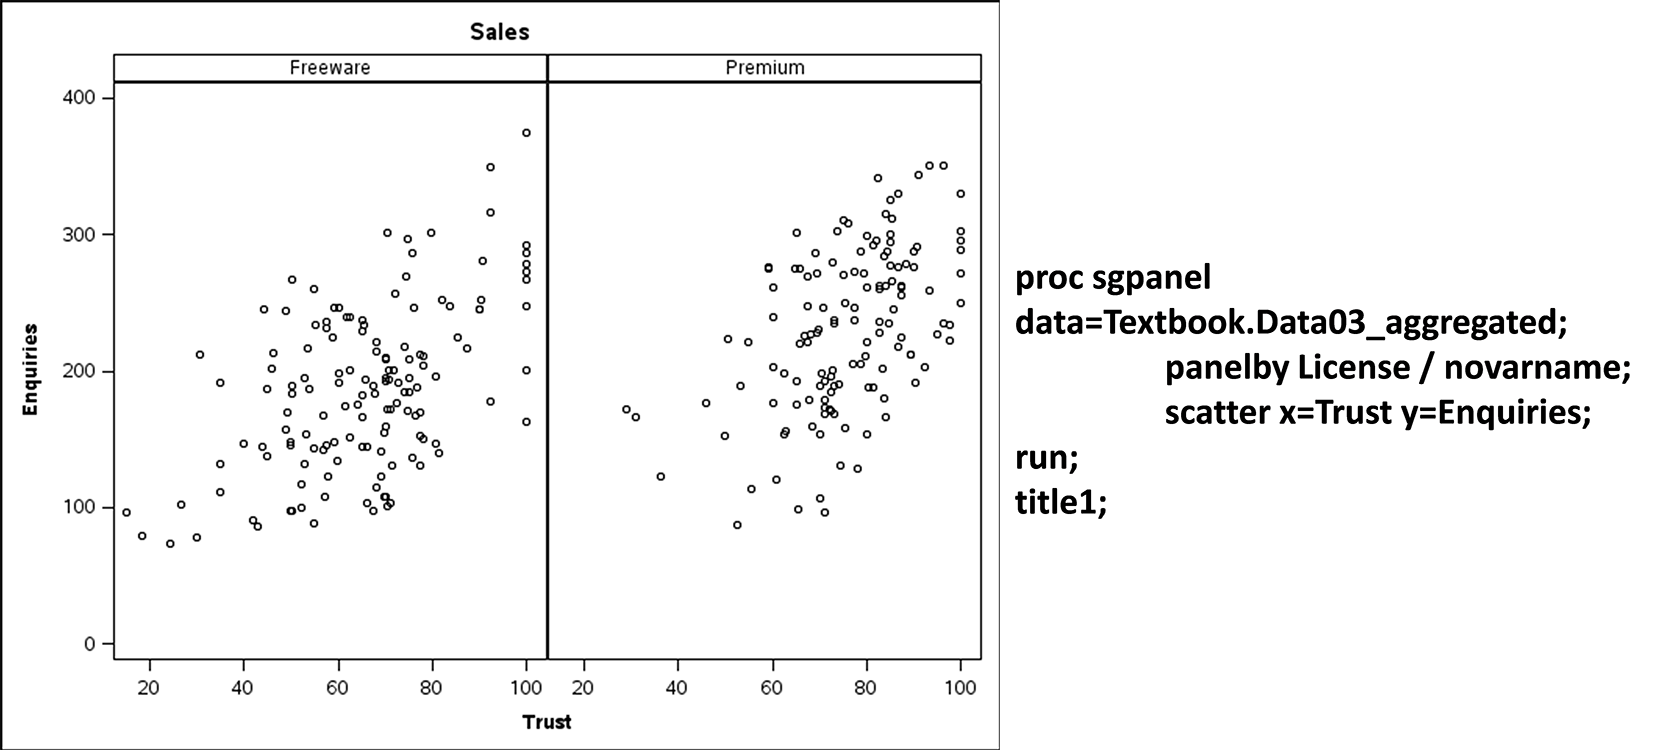
Note that this code
can be found in the “Code10b SGPANEL Graph example”
in the textbook materials folder. Any type of plot can similarly be
developed in tables of comparative graphs.
Last updated: April 18, 2017
..................Content has been hidden....................
You can't read the all page of ebook, please click here login for view all page.