
1.3 The Embedded System Design Process
This section provides an overview of the embedded system design process aimed at two objectives. First, it will give us an introduction to the various steps in embedded system design before we delve into them in more detail. Second, it will allow us to consider the design methodology itself. A design methodology is important for three reasons. First, it allows us to keep a scorecard on a design to ensure that we have done everything we need to do, such as optimizing performance or performing functional tests. Second, it allows us to develop computer-aided design tools. Developing a single program that takes in a concept for an embedded system and emits a completed design would be a daunting task, but by first breaking the process into manageable steps, we can work on automating (or at least semiautomating) the steps one at a time. Third, a design methodology makes it much easier for members of a design team to communicate. By defining the overall process, team members can more easily understand what they are supposed to do, what they should receive from other team members at certain times, and what they are to hand off when they complete their assigned steps. Because most embedded systems are designed by teams, coordination is perhaps the most important role of a well-defined design methodology.
Figure 1.1 summarizes the major steps in the embedded system design process. In this top-down view, we start with the system requirements. In the next step, specification, we create a more detailed description of what we want. But the specification states only how the system behaves, not how it is built. The details of the system’s internals begin to take shape when we develop the architecture, which gives the system structure in terms of large components. Once we know the components we need, we can design those components, including both software modules and any specialized hardware we need. Based on those components, we can finally build a complete system.

Figure 1.1 Major levels of abstraction in the design process.
In this section we will consider design from the top down—we will begin with the most abstract description of the system and conclude with concrete details. The alternative is a bottom-up view in which we start with components to build a system. Bottom-up design steps are shown in the figure as dashed-line arrows. We need bottom-up design because we do not have perfect insight into how later stages of the design process will turn out. Decisions at one stage of design are based upon estimates of what will happen later: How fast can we make a particular function run? How much memory will we need? How much system bus capacity do we need? If our estimates are inadequate, we may have to backtrack and amend our original decisions to take the new facts into account. In general, the less experience we have with the design of similar systems, the more we will have to rely on bottom-up design information to help us refine the system.
But the steps in the design process are only one axis along which we can view embedded system design. We also need to consider the major goals of the design:
We must also consider the tasks we need to perform at every step in the design process. At each step in the design, we add detail:
• We must analyze the design at each step to determine how we can meet the specifications.
• We must then refine the design to add detail.
• And we must verify the design to ensure that it still meets all system goals, such as cost, speed, and so on.
1.3.1 Requirements
Clearly, before we design a system, we must know what we are designing. The initial stages of the design process capture this information for use in creating the architecture and components. We generally proceed in two phases: First, we gather an informal description from the customers known as requirements, and we refine the requirements into a specification that contains enough information to begin designing the system architecture.
Requirements vs. specifications
Separating out requirements analysis and specification is often necessary because of the large gap between what the customers can describe about the system they want and what the architects need to design the system. Consumers of embedded systems are usually not themselves embedded system designers or even product designers. Their understanding of the system is based on how they envision users’ interactions with the system. They may have unrealistic expectations as to what can be done within their budgets, and they may also express their desires in a language very different from system architects’ jargon. Capturing a consistent set of requirements from the customer and then massaging those requirements into a more formal specification is a structured way to manage the process of translating from the consumer’s language to the designer’s.
Requirements may be functional or nonfunctional. We must of course capture the basic functions of the embedded system, but functional description is often not sufficient. Typical nonfunctional requirements include
• Performance: The speed of the system is often a major consideration both for the usability of the system and for its ultimate cost. As we have noted, performance may be a combination of soft performance metrics such as approximate time to perform a user-level function and hard deadlines by which a particular operation must be completed.
• Cost: The target cost or purchase price for the system is almost always a consideration. Cost typically has two major components: manufacturing cost includes the cost of components and assembly; nonrecurring engineering (NRE) costs include the personnel and other costs of designing the system.
• Physical size and weight: The physical aspects of the final system can vary greatly depending upon the application. An industrial control system for an assembly line may be designed to fit into a standard-size rack with no strict limitations on weight. A handheld device typically has tight requirements on both size and weight that can ripple through the entire system design.
• Power consumption: Power, of course, is important in battery-powered systems and is often important in other applications as well. Power can be specified in the requirements stage in terms of battery life—the customer is unlikely to be able to describe the allowable wattage.
Validating requirements
Validating a set of requirements is ultimately a psychological task because it requires understanding both what people want and how they communicate those needs. One good way to refine at least the user interface portion of a system’s requirements is to build a mock-up. The mock-up may use canned data to simulate functionality in a restricted demonstration, and it may be executed on a PC or a workstation. But it should give the customer a good idea of how the system will be used and how the user can react to it. Physical, nonfunctional models of devices can also give customers a better idea of characteristics such as size and weight.
Simple requirements form
Requirements analysis for big systems can be complex and time consuming. However, capturing a relatively small amount of information in a clear, simple format is a good start toward understanding system requirements. To introduce the discipline of requirements analysis as part of system design, we will use a simple requirements methodology.
Figure 1.2 shows a sample requirements form that can be filled out at the start of the project. We can use the form as a checklist in considering the basic characteristics of the system. Let’s consider the entries in the form:
• Name: This is simple but helpful. Giving a name to the project not only simplifies talking about it to other people but can also crystallize the purpose of the machine.
• Purpose: This should be a brief one- or two-line description of what the system is supposed to do. If you can’t describe the essence of your system in one or two lines, chances are that you don’t understand it well enough.
• Inputs and outputs: These two entries are more complex than they seem. The inputs and outputs to the system encompass a wealth of detail:
• Types of data: Analog electronic signals? Digital data? Mechanical inputs?
• Data characteristics: Periodically arriving data, such as digital audio samples? Occasional user inputs? How many bits per data element?
• Types of I/O devices: Buttons? Analog/digital converters? Video displays?
• Functions: This is a more detailed description of what the system does. A good way to approach this is to work from the inputs to the outputs: When the system receives an input, what does it do? How do user interface inputs affect these functions? How do different functions interact?
• Performance: Many embedded computing systems spend at least some time controlling physical devices or processing data coming from the physical world. In most of these cases, the computations must be performed within a certain time frame. It is essential that the performance requirements be identified early because they must be carefully measured during implementation to ensure that the system works properly.
• Manufacturing cost: This includes primarily the cost of the hardware components. Even if you don’t know exactly how much you can afford to spend on system components, you should have some idea of the eventual cost range. Cost has a substantial influence on architecture: A machine that is meant to sell at $10 most likely has a very different internal structure than a $100 system.
• Power: Similarly, you may have only a rough idea of how much power the system can consume, but a little information can go a long way. Typically, the most important decision is whether the machine will be battery powered or plugged into the wall. Battery-powered machines must be much more careful about how they spend energy.
• Physical size and weight: You should give some indication of the physical size of the system to help guide certain architectural decisions. A desktop machine has much more flexibility in the components used than, for example, a lapel-mounted voice recorder.

Figure 1.2 Sample requirements form.
A more thorough requirements analysis for a large system might use a form similar to Figure 1.2 as a summary of the longer requirements document. After an introductory section containing this form, a longer requirements document could include details on each of the items mentioned in the introduction. For example, each individual feature described in the introduction in a single sentence may be described in detail in a section of the specification.
Internal consistency of requirements
After writing the requirements, you should check them for internal consistency: Did you forget to assign a function to an input or output? Did you consider all the modes in which you want the system to operate? Did you place an unrealistic number of features into a battery-powered, low-cost machine?
To practice the capture of system requirements, Example 1.1 creates the requirements for a GPS moving map system.
Example 1.1 Requirements Analysis of a GPS Moving Map
The moving map is a handheld device that displays for the user a map of the terrain around the user’s current position; the map display changes as the user and the map device change position. The moving map obtains its position from the GPS, a satellite-based navigation system. The moving map display might look something like this:
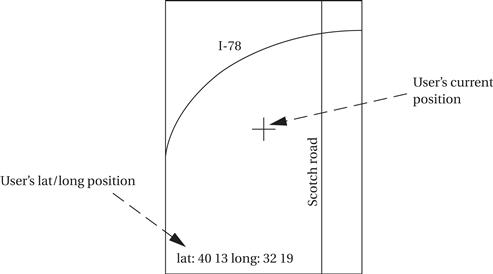
What requirements might we have for our GPS moving map? Here is an initial list:
• Functionality: This system is designed for highway driving and similar uses, not nautical or aviation uses that require more specialized databases and functions. The system should show major roads and other landmarks available in standard topographic databases.
• User interface: The screen should have at least 400 × 600 pixel resolution. The device should be controlled by no more than three buttons. A menu system should pop up on the screen when buttons are pressed to allow the user to make selections to control the system.
• Performance: The map should scroll smoothly. Upon power-up, a display should take no more than one second to appear, and the system should be able to verify its position and display the current map within 15 seconds.
• Cost: The selling cost (street price) of the unit should be no more than $120.
• Physical size and weight: The device should fit comfortably in the palm of the hand.
• Power consumption: The device should run for at least eight hours on four AA batteries, with at least 30 minutes of those eight hours comprising operation with the screen on.
Notice that many of these requirements are not specified in engineering units—for example, physical size is measured relative to a hand, not in centimeters. Although these requirements must ultimately be translated into something that can be used by the designers, keeping a record of what the customer wants can help to resolve questions about the specification that may crop up later during design.
Based on this discussion, let’s write a requirements chart for our moving map system:
| Name | GPS moving map |
| Purpose | Consumer-grade moving map for driving use |
| Inputs | Power button, two control buttons |
| Outputs | Back-lit LCD display 400 × 600 |
| Functions | Uses 5-receiver GPS system; three user-selectable resolutions; always displays current latitude and longitude |
| Performance | Updates screen within 0.25 seconds upon movement |
| Manufacturing cost | $40 |
| Power | 100 mW |
| Physical size and weight | No more than 2″ × 6″, 12 ounces |
This chart adds some requirements in engineering terms that will be of use to the designers. For example, it provides actual dimensions of the device. The manufacturing cost was derived from the selling price by using a simple rule of thumb: The selling price is four to five times the cost of goods sold (the total of all the component costs).
1.3.2 Specification
The specification is more precise—it serves as the contract between the customer and the architects. As such, the specification must be carefully written so that it accurately reflects the customer’s requirements and does so in a way that can be clearly followed during design.
Specification is probably the least familiar phase of this methodology for neophyte designers, but it is essential to creating working systems with a minimum of designer effort. Designers who lack a clear idea of what they want to build when they begin typically make faulty assumptions early in the process that aren’t obvious until they have a working system. At that point, the only solution is to take the machine apart, throw away some of it, and start again. Not only does this take a lot of extra time, the resulting system is also very likely to be inelegant, kludgy, and bug-ridden.
The specification should be understandable enough so that someone can verify that it meets system requirements and overall expectations of the customer. It should also be unambiguous enough that designers know what they need to build. Designers can run into several different types of problems caused by unclear specifications. If the behavior of some feature in a particular situation is unclear from the specification, the designer may implement the wrong functionality. If global characteristics of the specification are wrong or incomplete, the overall system architecture derived from the specification may be inadequate to meet the needs of implementation.
A specification of the GPS system would include several components:
• data received from the GPS satellite constellation;
• operations that must be performed to satisfy customer requests;
• background actions required to keep the system running, such as operating the GPS receiver.
UML, a language for describing specifications, will be introduced in the next section. We will practice writing specifications in each chapter as we work through example system designs. We will also study specification techniques in more detail in Chapter 7.
1.3.3 Architecture Design
The specification does not say how the system does things, only what the system does. Describing how the system implements those functions is the purpose of the architecture. The architecture is a plan for the overall structure of the system that will be used later to design the components that make up the architecture. The creation of the architecture is the first phase of what many designers think of as design.
To understand what an architectural description is, let’s look at a sample architecture for the moving map of Example 1.1. Figure 1.3 shows a sample system architecture in the form of a block diagram that shows major operations and data flows among them. This block diagram is still quite abstract—we haven’t yet specified which operations will be performed by software running on a CPU, what will be done by special-purpose hardware, and so on. The diagram does, however, go a long way toward describing how to implement the functions described in the specification. We clearly see, for example, that we need to search the topographic database and to render (i.e., draw) the results for the display. We have chosen to separate those functions so that we can potentially do them in parallel—performing rendering separately from searching the database may help us update the screen more fluidly.
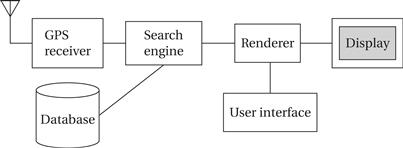
Figure 1.3 Block diagram for the moving map.
Only after we have designed an initial architecture that is not biased toward too many implementation details should we refine that system block diagram into two block diagrams: one for hardware and another for software. These two more refined block diagrams are shown in Figure 1.4. The hardware block diagram clearly shows that we have one central CPU surrounded by memory and I/O devices. In particular, we have chosen to use two memories: a frame buffer for the pixels to be displayed and a separate program/data memory for general use by the CPU. The software block diagram fairly closely follows the system block diagram, but we have added a timer to control when we read the buttons on the user interface and render data onto the screen. To have a truly complete architectural description, we require more detail, such as where units in the software block diagram will be executed in the hardware block diagram and when operations will be performed in time.
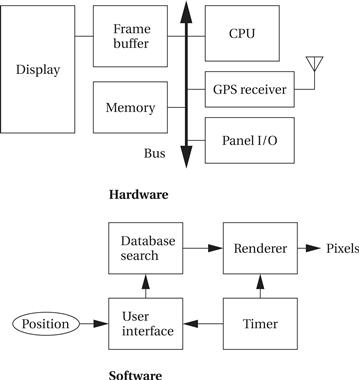
Figure 1.4 Hardware and software architectures for the moving map.
Architectural descriptions must be designed to satisfy both functional and nonfunctional requirements. Not only must all the required functions be present, but we must meet cost, speed, power, and other nonfunctional constraints. Starting out with a system architecture and refining that to hardware and software architectures is one good way to ensure that we meet all specifications: We can concentrate on the functional elements in the system block diagram, and then consider the nonfunctional constraints when creating the hardware and software architectures.
How do we know that our hardware and software architectures in fact meet constraints on speed, cost, and so on? We must somehow be able to estimate the properties of the components of the block diagrams, such as the search and rendering functions in the moving map system. Accurate estimation derives in part from experience, both general design experience and particular experience with similar systems. However, we can sometimes create simplified models to help us make more accurate estimates. Sound estimates of all nonfunctional constraints during the architecture phase are crucial, because decisions based on bad data will show up during the final phases of design, indicating that we did not, in fact, meet the specification.
1.3.4 Designing Hardware and Software Components
The architectural description tells us what components we need. The component design effort builds those components in conformance to the architecture and specification. The components will in general include both hardware—field-programmable gate arrays (FPGAs), boards, and so on—and software modules.
Some of the components will be ready-made. The CPU, for example, will be a standard component in almost all cases, as will memory chips and many other components. In the moving map, the GPS receiver is a good example of a specialized component that will nonetheless be a predesigned, standard component. We can also make use of standard software modules. One good example is the topographic database. Standard topographic databases exist, and you probably want to use standard routines to access the database—not only is the data in a predefined format, but it is highly compressed to save storage. Using standard software for these access functions not only saves us design time, but it may give us a faster implementation for specialized functions such as the data decompression phase.
You will have to design some components yourself. Even if you are using only standard integrated circuits, you may have to design the printed circuit board that connects them. You will probably have to do a lot of custom programming as well. When creating these embedded software modules, you must of course make use of your expertise to ensure that the system runs properly in real time and that it doesn’t take up more memory space than is allowed. The power consumption of the moving map software example is particularly important. You may need to be very careful about how you read and write memory to minimize power—for example, because memory accesses are a major source of power consumption, memory transactions must be carefully planned to avoid reading the same data several times.
1.3.5 System Integration
Only after the components are built do we have the satisfaction of putting them together and seeing a working system. Of course, this phase usually consists of a lot more than just plugging everything together and standing back. Bugs are typically found during system integration, and good planning can help us find the bugs quickly. By building up the system in phases and running properly chosen tests, we can often find bugs more easily. If we debug only a few modules at a time, we are more likely to uncover the simple bugs and be able to easily recognize them. Only by fixing the simple bugs early will we be able to uncover the more complex or obscure bugs that can be identified only by giving the system a hard workout. We need to ensure during the architectural and component design phases that we make it as easy as possible to assemble the system in phases and test functions relatively independently.
System integration is difficult because it usually uncovers problems. It is often hard to observe the system in sufficient detail to determine exactly what is wrong—the debugging facilities for embedded systems are usually much more limited than what you would find on desktop systems. As a result, determining why things don’t work correctly and how they can be fixed is a challenge in itself. Careful attention to inserting appropriate debugging facilities during design can help ease system integration problems, but the nature of embedded computing means that this phase will always be a challenge.
1.3.6 Formalisms for System Design
As mentioned in the last section, we perform a number of different design tasks at different levels of abstraction throughout this book: creating requirements and specifications, architecting the system, designing code, and designing tests. It is often helpful to conceptualize these tasks in diagrams. Luckily, there is a visual language that can be used to capture all these design tasks: the Unified Modeling Language (UML)[Boo99, Pil05]. UML was designed to be useful at many levels of abstraction in the design process. UML is useful because it encourages design by successive refinement and progressively adding detail to the design, rather than rethinking the design at each new level of abstraction.
UML is an object-oriented modeling language. Object-oriented design emphasizes two concepts of importance:
• It encourages the design to be described as a number of interacting objects, rather than a few large monolithic blocks of code.
• At least some of those objects will correspond to real pieces of software or hardware in the system. We can also use UML to model the outside world that interacts with our system, in which case the objects may correspond to people or other machines. It is sometimes important to implement something we think of at a high level as a single object using several distinct pieces of code or to otherwise break up the object correspondence in the implementation. However, thinking of the design in terms of actual objects helps us understand the natural structure of the system.
Object-oriented (often abbreviated OO) specification can be seen in two complementary ways:
• Object-oriented specification allows a system to be described in a way that closely models real-world objects and their interactions.
• Object-oriented specification provides a basic set of primitives that can be used to describe systems with particular attributes, irrespective of the relationships of those systems’ components to real-world objects.
Both views are useful. At a minimum, object-oriented specification is a set of linguistic mechanisms. In many cases, it is useful to describe a system in terms of real-world analogs. However, performance, cost, and so on may dictate that we change the specification to be different in some ways from the real-world elements we are trying to model and implement. In this case, the object-oriented specification mechanisms are still useful.
Object-oriented design vs. programming
What is the relationship between an object-oriented specification and an object-oriented programming language (such as C++ [Str97])? A specification language may not be executable. But both object-oriented specification and programming languages provide similar basic methods for structuring large systems.
UML is a large language, and covering all of it is beyond the scope of this book. In this section, we introduce only a few basic concepts. In later chapters, as we need a few more UML concepts, we introduce them to the basic modeling elements introduced here. Because UML is so rich, there are many graphical elements in a UML diagram. It is important to be careful to use the correct drawing to describe something—for instance, UML distinguishes between arrows with open and filled-in arrowheads, and solid and broken lines. As you become more familiar with the language, uses of the graphical primitives will become more natural to you.
We also won’t take a strict object-oriented approach. We may not always use objects for certain elements of a design—in some cases, such as when taking particular aspects of the implementation into account, it may make sense to use another design style. However, object-oriented design is widely applicable, and no designer can consider himself or herself design literate without understanding it.
1.3.7 Structural Description
By structural description, we mean the basic components of the system; we will learn how to describe how these components act in the next section. The principal component of an object-oriented design is, naturally enough, the object. An object includes a set of attributes that define its internal state. When implemented in a programming language, these attributes usually become variables or constants held in a data structure. In some cases, we will add the type of the attribute after the attribute name for clarity, but we do not always have to specify a type for an attribute. An object describing a display (such as a CRT screen) is shown in UML notation in Figure 1.5. The text in the folded-corner–page icon is a note; it does not correspond to an object in the system and only serves as a comment. The attribute is, in this case, an array of pixels that holds the contents of the display. The object is identified in two ways: It has a unique name, and it is a member of a class. The name is underlined to show that this is a description of an object and not of a class.
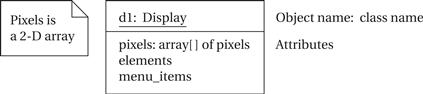
Figure 1.5 An object in UML notation.
Classes as types
A class is a form of type definition—all objects derived from the same class have the same characteristics, although their attributes may have different values. A class defines the attributes that an object may have. It also defines the operations that determine how the object interacts with the rest of the world. In a programming language, the operations would become pieces of code used to manipulate the object. The UML description of the Display class is shown in Figure 1.6. The class has the name that we saw used in the d1 object because d1 is an instance of class Display. The Display class defines the pixels attribute seen in the object; remember that when we instantiate the class an object, that object will have its own memory so that different objects of the same class have their own values for the attributes. Other classes can examine and modify class attributes; if we have to do something more complex than use the attribute directly, we define a behavior to perform that function.
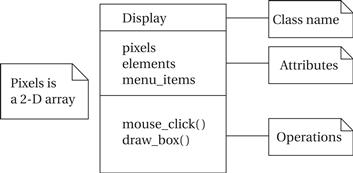
Figure 1.6 A class in UML notation.
A class defines both the interface for a particular type of object and that object’s implementation. When we use an object, we do not directly manipulate its attributes—we can only read or modify the object’s state through the operations that define the interface to the object. (The implementation includes both the attributes and whatever code is used to implement the operations.) As long as we do not change the behavior of the object seen at the interface, we can change the implementation as much as we want. This lets us improve the system by, for example, speeding up an operation or reducing the amount of memory required without requiring changes to anything else that uses the object.
Choose your interface properly
Clearly, the choice of an interface is a very important decision in object-oriented design. The proper interface must provide ways to access the object’s state (because we cannot directly see the attributes) as well as ways to update the state. We need to make the object’s interface general enough so that we can make full use of its capabilities. However, excessive generality often makes the object large and slow. Big, complex interfaces also make the class definition difficult for designers to understand and use properly.
There are several types of relationships that can exist between objects and classes:
• Association occurs between objects that communicate with each other but have no ownership relationship between them.
• Aggregation describes a complex object made of smaller objects.
• Composition is a type of aggregation in which the owner does not allow access to the component objects.
• Generalization allows us to define one class in terms of another.
The elements of a UML class or object do not necessarily directly correspond to statements in a programming language—if the UML is intended to describe something more abstract than a program, there may be a significant gap between the contents of the UML and a program implementing it. The attributes of an object do not necessarily reflect variables in the object. An attribute is some value that reflects the current state of the object. In the program implementation, that value could be computed from some other internal variables. The behaviors of the object would, in a higher-level specification, reflect the basic things that can be done with an object. Implementing all these features may require breaking up a behavior into several smaller behaviors—for example, initialize the object before you start to change its internal state.
Derived classes
UML, like most object-oriented languages, allows us to define one class in terms of another. An example is shown in Figure 1.7 where we derive two particular types of displays. The first, BW_display, describes a black-and-white display. This does not require us to add new attributes or operations, but we can specialize both to work on one-bit pixels. The second, Color_map_display, uses a graphic device known as a color map to allow the user to select from a large number of available colors even with a small number of bits per pixel. This class defines a color_map attribute that determines how pixel values are mapped onto display colors. A derived class inherits all the attributes and operations from its base class. In this class, Display is the base class for the two derived classes. A derived class is defined to include all the attributes of its base class. This relation is transitive—if Display were derived from another class, both BW_display and Color_map_display would inherit all the attributes and operations of Display’s base class as well. Inheritance has two purposes. It of course allows us to succinctly describe one class that shares some characteristics with another class. Even more important, it captures those relationships between classes and documents them. If we ever need to change any of the classes, knowledge of the class structure helps us determine the reach of changes—for example, should the change affect only Color_map_display objects or should it change all Display objects?
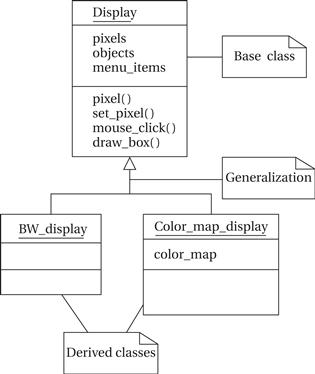
Figure 1.7 Derived classes as a form of generalization in UML.
Generalization and inheritance
UML considers inheritance to be one form of generalization. A generalization relationship is shown in a UML diagram as an arrow with an open (unfilled) arrowhead. Both BW_display and Color_map_display are specific versions of Display, so Display generalizes both of them. UML also allows us to define multiple inheritance, in which a class is derived from more than one base class. (Most object-oriented programming languages support multiple inheritance as well.) An example of multiple inheritance is shown in Figure 1.8; we have omitted the details of the classes’ attributes and operations for simplicity. In this case, we have created a Multimedia_display class by combining the Display class with a Speaker class for sound. The derived class inherits all the attributes and operations of both its base classes, Display and Speaker. Because multiple inheritance causes the sizes of the attribute set and operations to expand so quickly, it should be used with care.

Figure 1.8 Multiple inheritance in UML.
A link describes a relationship between objects; association is to link as class is to object. We need links because objects often do not stand alone; associations let us capture type information about these links. Figure 1.9 shows examples of links and an association. When we consider the actual objects in the system, there is a set of messages that keeps track of the current number of active messages (two in this example) and points to the active messages. In this case, the link defines the contains relation. When generalized into classes, we define an association between the message set class and the message class. The association is drawn as a line between the two labeled with the name of the association, namely, contains. The ball and the number at the message class end indicate that the message set may include zero or more message objects. Sometimes we may want to attach data to the links themselves; we can specify this in the association by attaching a class-like box to the association’s edge, which holds the association’s data.
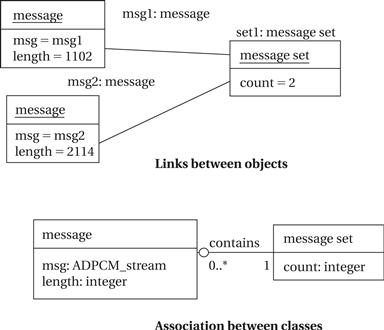
Figure 1.9 Links and associations.
Typically, we find that we use a certain combination of elements in an object or class many times. We can give these patterns names, which are called stereotypes in UML. A stereotype name is written in the form ![]() signal
signal![]() . Figure 1.11 shows a stereotype for a signal, which is a communication mechanism.
. Figure 1.11 shows a stereotype for a signal, which is a communication mechanism.
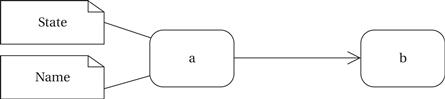
Figure 1.10 A state and transition in UML.
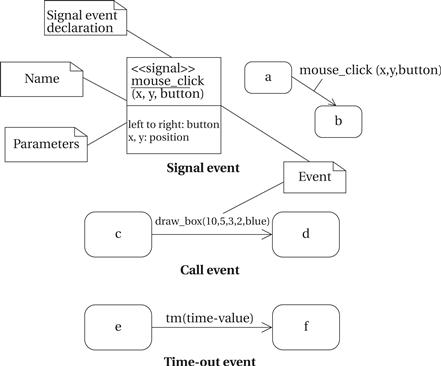
Figure 1.11 Signal, call, and time-out events in UML.
1.3.8 Behavioral Description
We have to specify the behavior of the system as well as its structure. One way to specify the behavior of an operation is a state machine. Figure 1.10 shows UML states; the transition between two states is shown by a skeleton arrow.
These state machines will not rely on the operation of a clock, as in hardware; rather, changes from one state to another are triggered by the occurrence of events. An event is some type of action. The event may originate outside the system, such as a user pressing a button. It may also originate inside, such as when one routine finishes its computation and passes the result on to another routine. We will concentrate on the following three types of events defined by UML, as illustrated in Figure 1.11:
• A signal is an asynchronous occurrence. It is defined in UML by an object that is labeled as a «signal». The object in the diagram serves as a declaration of the event’s existence. Because it is an object, a signal may have parameters that are passed to the signal’s receiver.
• A call event follows the model of a procedure call in a programming language.
• A time-out event causes the machine to leave a state after a certain amount of time. The label tm(time-value) on the edge gives the amount of time after which the transition occurs. A time-out is generally implemented with an external timer. This notation simplifies the specification and allows us to defer implementation details about the time-out mechanism.
We show the occurrence of all types of signals in a UML diagram in the same way—as a label on a transition.
Let’s consider a simple state machine specification to understand the semantics of UML state machines. A state machine for an operation of the display is shown in Figure 1.12. The start and stop states are special states that help us organize the flow of the state machine. The states in the state machine represent different conceptual operations. In some cases, we take conditional transitions out of states based on inputs or the results of some computation done in the state. In other cases, we make an unconditional transition to the next state. Both the unconditional and conditional transitions make use of the call event. Splitting a complex operation into several states helps document the required steps, much as subroutines can be used to structure code.

Figure 1.12 A state machine specification in UML.
It is sometimes useful to show the sequence of operations over time, particularly when several objects are involved. In this case, we can create a sequence diagram, like the one for a mouse click scenario shown in Figure 1.13. A sequence diagram is somewhat similar to a hardware timing diagram, although the time flows vertically in a sequence diagram, whereas time typically flows horizontally in a timing diagram. The sequence diagram is designed to show a particular scenario or choice of events—it is not convenient for showing a number of mutually exclusive possibilities. In this case, the sequence shows what happens when a mouse click is on the menu region. Processing includes three objects shown at the top of the diagram. Extending below each object is its lifeline, a dashed line that shows how long the object is alive. In this case, all the objects remain alive for the entire sequence, but in other cases objects may be created or destroyed during processing. The boxes along the lifelines show the focus of control in the sequence, that is, when the object is actively processing. In this case, the mouse object is active only long enough to create the mouse_click event. The display object remains in play longer; it in turn uses call events to invoke the menu object twice: once to determine which menu item was selected and again to actually execute the menu call. The find_region(![]() ) call is internal to the display object, so it does not appear as an event in the diagram.
) call is internal to the display object, so it does not appear as an event in the diagram.
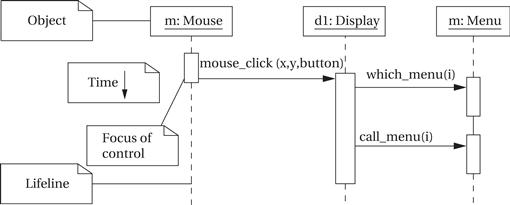
Figure 1.13 A sequence diagram in UML.