7
Aircraft Statistics, Configuration Choices and Layout
7.1 Overview
The design considerations of aircraft components, for example, the wings, empennages, fuselages, nacelle pods, intakes and associated systems, are presented in Chapters 4–6 to generate boilerplate templates of aircraft configurations at the conceptual stage. This chapter progresses to the next phase to see aircraft as a whole, all components assembled from the available multitude of options to generate possible preliminary candidate configuration for a new aircraft project with given requirements and specifications. A large number of various types of aircraft configurations are included in this chapter for the readers to examine the options available. These large varieties of configurations should assist in some creative thinking on how to combine the various options of aircraft components. This is the last chapter in Part I, serving as the prerequisite information to carry out the aircraft design exercises dealt with in Chapter 8 (Part II). Chapter 7 gives configuration choices and supporting statistics, and details pertinent to aircraft configuration. Undercarriages and power‐plants are dealt with separately in Chapters 9 and 10.
During the last century, many aircraft configurations have appeared in their time; today, most of those are not relevant to the current practices. One good example is the Douglas DC3 Dakota manufactured in its thousands. Older designs, no matter how good they were, cannot compete with today's designs. This book addresses only those well‐established currently operating designs as shown in the recent Jane's All the World's Aircraft Manual [1]; however, references are made to some interesting and unique older aircraft configurations. These older designs may not be applicable to the current practices but they offer some interesting innovative ideas to study.
Section 1.3 showed growth patterns in the aircraft operational envelope (e.g. speed‐altitude capabilities). It continued with a classification (Section 1.3.1) of generic aircraft types that show distinct patterns within the class in order to narrow down the wide variety of choices available. Statistics is a powerful tool for establishing design trends and some pertinent statistical parameters are provided herein.
The first part of this chapter presents the statistics of the past aircraft designs. This provides a tool for trend analyses of aircraft designs. The trend analyses show remarkable correlations, irrespective of their design origins from various countries. The statistical analyses give some idea of what to expect from the proposed new aircraft, that is, typical weights, wing area, thrust loading empennage sizes and so on. The current design and configuration parameters serve as the template for identifying considerations that could influence new designs with improvements.
This chapter also shows various types of aircraft and how they are configured, for example, incorporating types of wing planform, fuselage shape, intake shapes and positioning and empennage arrangements as the ‘building blocks’ for shaping an aircraft in many possible configurations. Artistic aesthetics are considered as long as they do not unduly penalise aircraft cost and performance. The new Boeing787 Dreamliner (see Figure 1.8) and Airbus350 aircraft shapes are good examples of the respective companies' latest high‐subsonic commercial transport aircraft. It is interesting that the Dreamliner configuration transitioned to the new B787 with more conventional aero‐shaping. The B787's advances in technology were not as radical a venture compared to Boeing's earlier Sonic Cruiser proposal (see Figure 7.18a), which was shelved. These decisions were made by one of the world's biggest and best companies; the Sonic Cruiser was not a fantasy – it simply was not timed right for market demand. This signifies the importance of conducting a market study, as emphasised in Chapter 2.
Along with the considerations to generate aircraft external mouldlines, the chapter covers the internal arrangements for the types of aircraft. These arrangements affect weight and must be studied at the conceptual design phase.
The important information given in this chapter will assist in developing a methodology of how to configure the proposed new aircraft with worked‐out examples as shown in the next Chapter 8. The readers should return to Chapters 2 through 7 to extract the information necessary to configure aircraft.
This chapter covers the following topics:
- Section 7.2: Chapter Introduction
- Section 7.3: Civil Aircraft Mission (Payload Range)
- Section 7.4: Civil Aircraft Statistics
- Section 7.5: Internal Arrangements of Fuselage – Civil Aircraft
- Section 7.6: Some Interesting Aircraft Configurations – Civil Aircraft
- Section 7.7: Summary of Civil Aircraft Design Choices
- Section 7.8: Military Aircraft Detailed Classification
- Section 7.9: Military Aircraft Mission (Domain Served)
- Section 7.10: Military Aircraft Statistics (Template for New Design)
- Section 7.11: Military Aircraft Component Geometries (Possible Options)
- Section 7.12: Miscellaneous
- Section 7.13: Summary of Military Aircraft Design Choices
This chapter will be better understood after covering Chapters 8–16 (Part II), culminating in aircraft sizing and engine matching to concept finalisation by freezing the design for management to review for a possible ‘go‐ahead’.
7.2 Introduction
This chapter studies past aircraft designs of topical interest to demonstrate that a definite trend exists within the class of aircraft. Past designs have a strong influence on future designs; real‐life experience has no substitute and is dependable. It is therefore important that past information be properly synthesised by studying statistical trends and examining all aspects of influencing parameters in shaping a new aircraft – this is one of the goals of this book. Many types of aircraft are in production serving different sector requirements – civil and military missions differ substantially. It is important to classify aircraft categories in order to identify strong trends existing within each class.
Existing patterns of correlation (through regression analysis) within a class of aircraft indicate what may be expected from a new design. There are no surprise elements until new research establishes a radical change in technology or designers introduce a new class of aircraft. In civil aircraft design, a 10–15% improvement in the operating economics above the current designs within the class is considered good; a 15–20% improvement is excellent. Of course, economic improvements must be supported by gains in safety, reliability and maintainability, which in turn add to the cost.
Readers are encouraged to examine the potential emerging design trends within the class of aircraft. In general, new commercial aircraft designs are extensions of the existing designs that conservatively incorporate newer, proven technologies (some are fall‐outs from declassified military applications). Currently, the dominant aerodynamic design trends show diminishing returns on investment. Structure technologies seek suitable new materials (e.g. composites, metal alloys and smart adaptive materials) if they can reduce cost, weight and/or provide aerodynamic gains. Engine designs have scope for aerodynamic improvements to save on fuel consumption and/or weight. Chapter 1 highlights that the current challenges lie in manufacturing philosophy, better maintainability and reliability incorporating vastly improved and miniaturised systems (including microprocessor‐based avionics for control, navigation, communication and monitoring). This book briefly addresses these topics, particularly from the weight‐saving perspective. It is convenient to separate civil and military aircraft examples as their mission requirements are very different and cannot be compared (see Section 1.9).

Figure 7.1 Passengers versus range – statistics of 70 aircraft (Ref. [1–4]).
CIVIL AIRCRAFT
7.3 Civil Aircraft Mission (Payload Range)
The payload‐range capability constitutes the two most important parameters to represent the commercial transport aircraft operational role. These two are the basic aircraft requirements emerging out of market studies for new aircraft projects. From these two parameters, the aircraft mission profile and performance capabilities are specified.
The graph in Figure 7.1 [1–4] shows the payload‐range capabilities for several subsonic‐transport aircraft (i.e. turbofans and turboprops). The figure captures more than 50 different types of major current designs in operation. The points in the graph include the following aircraft: Lear 31A, Lear 45, Lear 60, Cessna 525A, Cess 650, Cess 500, Cess 550, Cess 560, Cess 560XL, ERJ 135ER, ERJ 140, ERJ 145ER, CRJ 100, CRJ 700, ERJ 170, DC‐9‐10, CRJ 900, ERJ 190, 737–100, 717–200, A318–100, A319–100, A320–100, Tu204, A321–100, 757–200, A310–200, 767–200, A330–200, L1011, A340–200, A300–600, A300–100, DC‐10‐10, MD11, 777–200, 747–100, A380, Short 330 and 360, ATR 42 and 72, Jetstream 31, SAAB 340A, Dash 7 and 8, Jetstream 41, EMB 120, EMB 120ER, Dornier 328–100 and Q400.
The trend shows that the range increases with payload increases, reflecting the market demand for the ability to fly longer distances. Long‐range aircraft will have fewer sorties and will need to carry more passengers at one time. The classic comparison between the A380 versus the B747 passenger capacity is captured within the envelope shown between the two straight lines in the figure. It is interesting that there are the high‐subsonic, long‐distance executive jets, the Bombardier Global Express and Gulfstream V (not shown in the figure) carrying executives and a small number of passengers very long ranges (>6500 nm) at a considerably higher operating cost per passenger. At the other extreme, there are almost no products carrying a high passenger load for shorter ranges (i.e. <2000 nm). The authors consider that the future may show potential markets in this class of aircraft in highly populated large countries. Countries with substantial population centres could fly more passengers within their borders, such as in China, India, Indonesia, Russia and the USA.
It is obvious that turboprop aircraft flying at slower speeds cater to the shorter‐range market sector as they provide better fuel economy than the jet aircraft. At short range missions, the relatively small time saving by operating faster jet aircraft is overridden by the economic gains using slower turboprop aircraft.
7.3.1 Civil Aircraft Economic Considerations
Commercial aircraft operation is singularly driven by revenue earned from the fare‐paying passengers and cargo. In the operating sector, passenger load factor (LFpax) is defined as the ratio of occupied seats to available seats, as follows.
Typically, for aircraft of medium sizes and larger, operational costs break even at approximately one‐third full capacity (this varies among airlines; fuel costs at 2000 level fuel price with regular fares) – that is, a load factor of about 0.33. Of course, the empty seats could be filled with deregulated reduced fares, thereby contributing to the revenue earned. Until the 1960s, passenger fares were fixed under government regulation. Since the 1970s, the airfare structure has been deregulated – an airline can determine its own airfare and vary as the market demands. With the inflation and increase in fuel price, the break‐even load factor, LFpax, has gone up in a fluctuating manner, in some cases exceeded 50%.
It is appropriate to introduce here the definition of the dictating economic parameter, seat‐mile cost, which represents the unit of the aircraft Direct Operating Cost (DOC) that determines airfares to meet operational costs and sustain profits. DOC is the total cost of operation for the mission sector. The US dollar is the international standard for aircraft cost estimation. Operational economics are discussed in detail in Chapter 16.

The seat‐mile cost is the aircraft operating cost per passenger per nautical mile (nm) of the mission sector. The higher the denominator in Equation 7.1, the lower is the seat‐mile cost (i.e. DOC). Therefore, the longer an aircraft flies and/or the more it carries, the lower the seat‐mile cost.
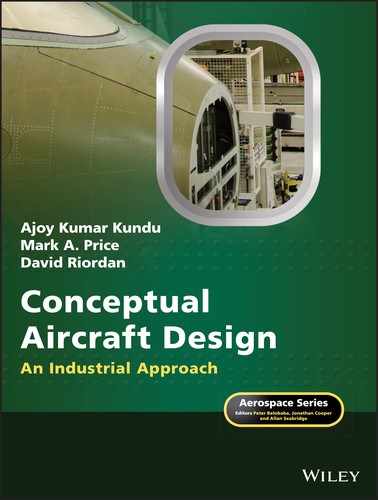
To get some idea, typical Seat‐Mile Costs (cents/seat/nm), are listed here. Turboprop Seat‐Mile Costs are about 10–20% in the comparable class, currently not bigger than regional jets.
A careful market study could fine‐tune an already overcrowded marketplace for a mission profile that offers economic gains with better designs. Section 2.5.1 addresses the market study so that readers understand its importance.
7.4 Civil Subsonic Jet Aircraft Statistics (Sizing Parameters)
Section 2.3 provides familiarisation with typical civil aircraft geometry and its components. This section gives statistical relations of aircraft geometry, weight and engine thrust of large number of aircraft. To have a refined relation, readers are encouraged to generate their own statistical data for the class of aircraft to be studied. It may be possible to eliminate a parameter or two if they are not close to the regression line, as well investigate the cause being not close to the regression line. This is the starting point that culminates in Chapter 16 through formal sizing to concept finalisation of the new aircraft.
This section examines the statistics of current aircraft geometry and weight to identify aircraft sizing parameters. Regression analyses are carried out to demonstrate a pattern as proof of expectations. With available statistics, aircraft can be roughly sized to meet specifications. Sections 1.14.1 and 1.14.2 may be referred to examine the benefits of using statistics, where applicable, compared to using empirical relations.
Definitions of various types of aircraft mass (i.e. weight) are provided in Chapter 9. Some of them are required in this section, as given next (payload could be passengers and/or cargo):
- MEM: Manufacturer's empty mass – the finished aircraft mass rolls out from the factory line.
- OEM: Operator's empty mass = MEM + crew + consumables – it is now ready for operation.
- MTOM: Maximum takeoff mass = OEM + payload + fuel, loaded to maximum design mass.
- OEMF: Operational Empty Mass Fraction = ratio of OEM to MTOM.
Mass per passenger is revised to 100 kg (220 lb) from the earlier value of 90 kg (200 lb), which includes baggage allowance.
In the USA, weight unit is in lb instead of mass in kg and uses their equivalents maximum takeoff weight (MTOW), OEW (Operator's Empty Weight), MEW (Manufacturer's Empty Weight) and OEWF (Operational Empty Weight Fraction).
7.4.1 Civil Aircraft Regression Analysis
There are definite statistical relationships between aircraft weight and geometries. The choices are made to configure aircraft not arbitrary – definite reasons are associated with the choices made. Figures 7.2--7.9 (except Figure 7.7) [2] indicate strong relational trends in geometry and weight within the class of aircraft studied evolved through design considerations. Chapters 4–6 covered relevant points on aircraft component properties and status, as summarised next.
- Wing group. Chapter 4 is concerned with planform shape and size of the wing. It gives various types of wing, their relation between aerofoil thickness to chord ratio and wing sweep versus Mach number. Options for high‐lift devices are described in Section 4.13. This chapter gives the statistics of wing size, wing load, aspect ratio (AR) and wing span versus aircraft weight.
- Fuselage and nacelle group. Chapter 5 is concerned with shaping and sizing of the fuselage. It gives statistics of fuselage; for example, cross‐section types, fuselage length for the passenger capacity, fineness ratio, seating arrangement and fore and aft end closure data. It also covered nacelle geometries and locations. This chapter covers the statics of engine size versus aircraft weight, which in turns gives the nacelle size.
- Empennage group. Chapter 6 is concerned with H‐tail and V‐tail geometries and introduces the role of tail volume coefficients. This chapter gives the statistics of H‐tail and V‐tail tail volume coefficients.
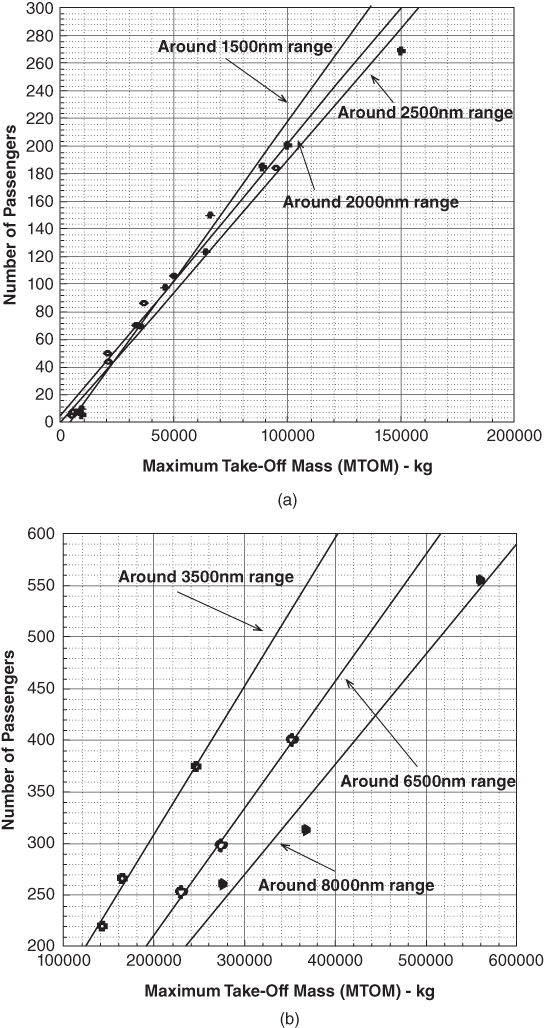
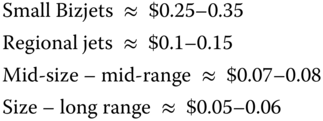
Figure 7.2 Number of passengers versus MTOM (high‐subsonic jet aircraft). (a) Lower capacity and (b) higher capacity.
7.4.2 Maximum Takeoff Mass versus Number of Passengers
Figure 7.2 describes the relationship between passenger (PAX) capacity and MTOM, which also depends on the mission range for carrying more fuel for longer ranges. In conjunction with Figure 7.1, it shows that lower‐capacity aircraft generally have lower ranges (Figure 7.2a) and higher‐capacity aircraft are intended for higher ranges (Figure 7.2b). Understandably, at lower ranges, the effect of fuel mass on MTOM is not shown as strongly as for longer ranges that require large amounts of fuel. There is no evidence of the square‐cube law, as discussed in Section 4.17. It is possible for the aircraft size to grow, provided the supporting infrastructure is sufficient.
Figure 7.2 shows an excellent regression of the statistical data. It is unlikely that this trend will be much different in the near future. Considerable scientific/technical breakthroughs will be required to move from the existing pattern to better values (the blended‐wing‐body (BWB) configuration is an example when it becomes available). Light but economically viable material, superior engine fuel economy, miniaturisation of systems architecture, microprocessor‐based aircraft and engine controls are some of the areas in which substantial weight reduction is possible.
In conjunction with Figure 7.2, it can be seen that longer‐range aircraft have higher MTOM per passenger as shown Table 7.1 Longer‐range capability requires carrying a higher proportion of fuel. Below 2500 nm, the accuracy degenerates; the weight for in‐between ranges is interpolated.
7.4.3 MTOM versus Operational Empty Mass
Figure 7.3 provides crucial information to establish the relationship between the MTOM and the OEM. Figure 7.3a shows the regression analysis of the MTOM versus the OEM for 26 turbofan aircraft, indicating a predictable OEM growth with MTOM being almost linear. At the lower end, aircraft with fewer than 70 passengers (i.e. Bizjet, utility and regional jet class) have a higher OEMF (around 0.6 – sharply decreasing). In the midrange (i.e. 70–200‐passenger class – single‐aisle, narrow‐body), the OEMF is around ≈0.55. At the higher end (i.e. more than 200 passengers – double‐aisle, wide‐body), it levels out at around ≈0.5 ± 0.05; the MTOM is about twice the OEM. The decreasing trend of the weight fraction is due to better structural efficiencies achieved with larger geometries, as well allowingmore accurate design and manufacturing methods.
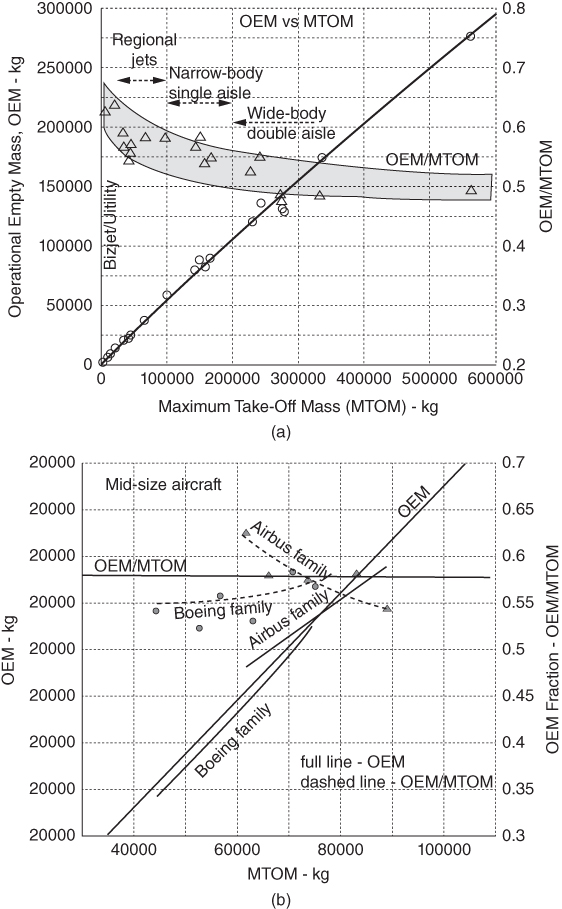
Figure 7.3 OEM versus MTOM (high‐subsonic jet aircraft). (a) All types of aircraft and (b) midrange – Boeing and Airbus families.
Aircraft load (see Chapter 17) is experienced on both the ground and in the air, which depends on the MTOM. The load in the air is a result of aircraft speed‐altitude capabilities, the manoeuvrability limit and wind. A higher speed capability would increase the OEMF to retain structural integrity; however, the OEM would reflect the range capability for the design payload at the MTOM (see Figure 7.3).
Table 7.1 MTOM per passenger versus range.
| Range, nm | MTOM/passenger, kg/PAX |
| 1500 | 400 |
| 3500 | 600 |
| 6500 | 900 |
| 8000 | 1050 |
Figure 7.3a is represented in higher resolution when it is plotted separately for the midsized aircraft, as shown in Figure 7.3b for midrange‐size aircraft. It also provides insight to the statistical relationship between the derivative aircraft of the Boeing737 and Airbus320 families. The approaches of the two companies are different. Boeing, which pioneered the idea, had to learn the approach to the family concept of design. The Boeing737‐100 was the baseline design, the smallest in the family. Its growth required corresponding growth in other aero‐structures yet maintaining component commonality as much as possible. Conversely, Airbus learned from the Boeing experience: Their baseline aircraft was the A320, in the middle of the family. The elongated version became the A321 by plugging in constant cross‐section fuselage sections in the front and aft of the wing, while retaining all other aero‐structures. In the shortened versions, the A319 came before the even shorter A318, maintaining the philosophy of retaining component commonalities. The variants were not the optimised size, but they were manufactured at a substantially lower cost on account of low development costs from retaining component commonality, decreasing the DOC and providing a competitive edge.
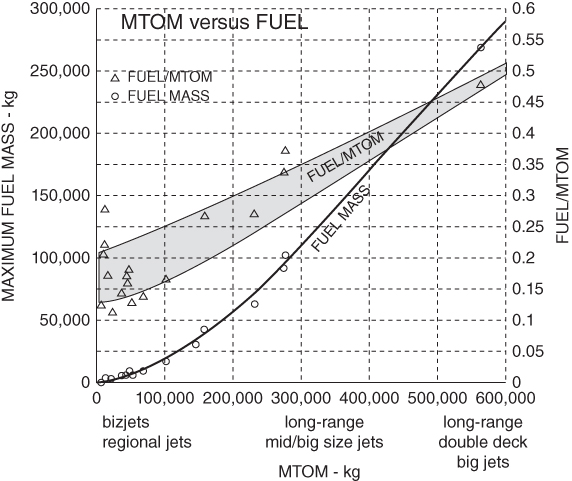
Figure 7.4 Maximum fuel load (full tank) versus MTOM (Ref. [2]).
7.4.4 MTOM versus Fuel Load
Figure 7.4 shows the relationship between fuel load, Mf and MTOM for 20 turbofan aircraft, this graph also shows the fuel fraction, Mf/MTOM. It may be examined in conjunction with Figures 7.1--7.3, which show the range increase with the increase in MTOM, fuel mass, Mf and fuel fraction, Mf/MTOM increase.
Fuel mass increases with aircraft size, reflecting today's market demand for longer ranges. The long‐range aircraft fuel load, including reserves, is about half the MTOM. For the same passenger capacity, there is statistical dispersion at the low end. This indicates that, for short ranges (around 1400 nm to cross‐country ranges of around 2500 nm), with a wider selection of comfort levels and choice of aerodynamic devices, the fuel content is determined by the varied market demand. At the higher end, the selection narrows, showing a linear trend. Figure 7.3 indicates that larger aircraft have better structural efficiency and Figure 7.4 indicates that they also have a higher fuel fraction for longer ranges.
7.4.5 MTOM versus Wing Area
Whereas the fuselage size is determined from the specified passenger capacity, the wing must be sized to meet performance constraints through a matched engine (see Chapter 14). Figure 7.5 shows the relationships between the wing planform reference area, SW and the wing loading, W/SW, versus the MTOM.

Figure 7.5 Wing area, SW, versus MTOM (Ref. [2]). (a) Small aircraft, (b) midrange single‐aisle narrow‐body aircraft and (c) large twin‐aisle wide‐body aircraft.
Wing loading, W/Sw, is defined as the ratio of the MTOM to the wing planform reference area (W/SW, kg m−2 or lbm ft−2, if expressed in terms of weight; then, the unit becomes N m−2 or lbf ft−2). This is a significant sizing parameter and has an important role in aircraft design.
The influence of wing loading is illustrated in the graphs in Figure 7.5. The tendency is to have lower wing loading for smaller aircraft and higher wing loading for larger aircraft operating at high‐subsonic speed. High wing loading requires the assistance of better high‐lift devices to operate at low speed; better high‐lift devices are heavier and more expensive. On account of the cost and complexities involved in sophisticated high‐lift devices, the current trend is to have lower wing load to accept simpler high‐lift devices (see Figure 4.34). These graphs are useful for obtaining a starting value (i.e. preliminary sizing) for a new aircraft design that would be refined through the sizing analysis.
The growth of the wing area with an in aircraft mass is necessary to sustain flight. A large wing planform area is required for better low‐speed field performance, which exceeds the cruise requirement. Therefore, wing‐sizing (see Chapter 14) provides the minimum wing planform area to simultaneously satisfy both the takeoff and the cruise requirements. Determination of wing loading is a result of the wing‐sizing exercise.
Smaller aircraft operate in smaller airfields. To keep the weight and cost down, simpler types of high‐lift devices are used in small aircraft. This results in lower wing loading 40–100 lb ft−2 (i.e. ≈200–500 kg m−2), as shown in Figure 7.5a. Aircraft with a range of more than 3000 nm need more efficient high‐lift devices. It was shown previously that aircraft size increases with increases in range, resulting in wing loading increases 80–150 lb ft−2 (i.e. ≈400–700 kg m−2 for midrange aircraft) when better high‐lift devices are considered.
Here, the trends for variants in the family of aircraft variant design can be examined and given in Figure 7.5b,c. The Airbus 320 baseline aircraft is in the middle of the family. Conversely, the Boeing 737 baseline aircraft started with the smallest in the family and was forced into wing growth with increases in weight and cost; this keeps changes in wing loading at a moderate level.
Larger aircraft have longer ranges; therefore, wing loading is higher to keep the wing area low, thereby decreasing induced drag. For large wide‐body twin‐aisle, subsonic jet aircraft (see Figure 7.8c), the picture is similar to the midrange‐sized, narrow‐body single‐aisle aircraft but with higher wing loadings to keep wing size relatively small (which counters the square‐cube law discussed in Section 4.17).
7.4.6 Wing Geometry – Area versus Loading, Span and Aspect Ratio
The main parameters associated with the wing are its area, AR, span and sweep. Figure 4.23 gives the relations of wing sweep, its aerofoil t/c versus maximum operating Mach number. Here, Figure 7.6 gives the relation between wing load, span and AR and wing area. It may be noted that wing AR requires consultation with the structural engineers to obtain the a high value. In the graph, the sample data are within 7–10. The AR shows a scattering trend. In the same wing‐span class, the AR could be increased with advanced technology but it is restricted by the increase in wing load. Current technology requires it is in a position to have an AR up to 15.
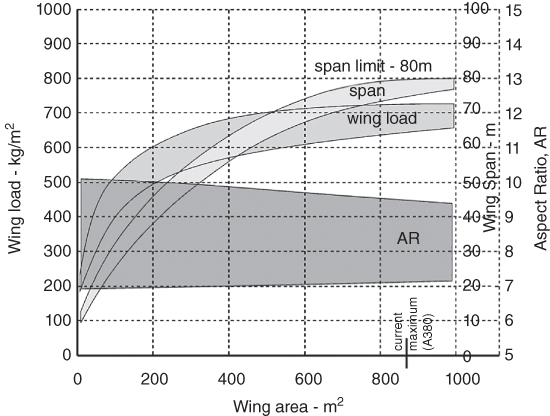
Figure 7.6 Wing geometry.
Figure 7.6 shows that the growth of the wing span is associated with the growth in wing loading.
With steady improvements in new material properties, miniaturisation of equipment and better fuel economy, wing span is increasing with the introduction of bigger aircraft (e.g. Airbus 380). Growth in size results in a wing root thickness large enough to encompass the fuselage depth when a BWB configuration becomes an attractive proposition for large‐capacity aircraft. Although technically feasible, it awaits market readiness, especially from the ground‐handling perspective at airports.
Examples of some current subsonic‐transport aircraft wing planforms are given in Figure 7.7.
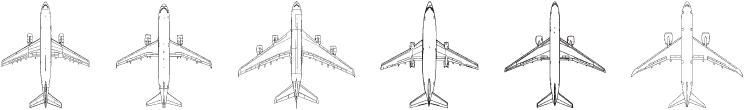
Figure 7.7 Civil aircraft wing planform shapes.
7.4.7 Empennage Area and Tail Volume Coefficients versus Wing Area
Once the wing area is established along with fuselage length, the empennage areas (i.e. H‐tail, SHT and V‐tail, SVT) can be estimated from the static stability requirements. Section 3.22 discusses the empennage tail volume coefficients to determine empennage areas.
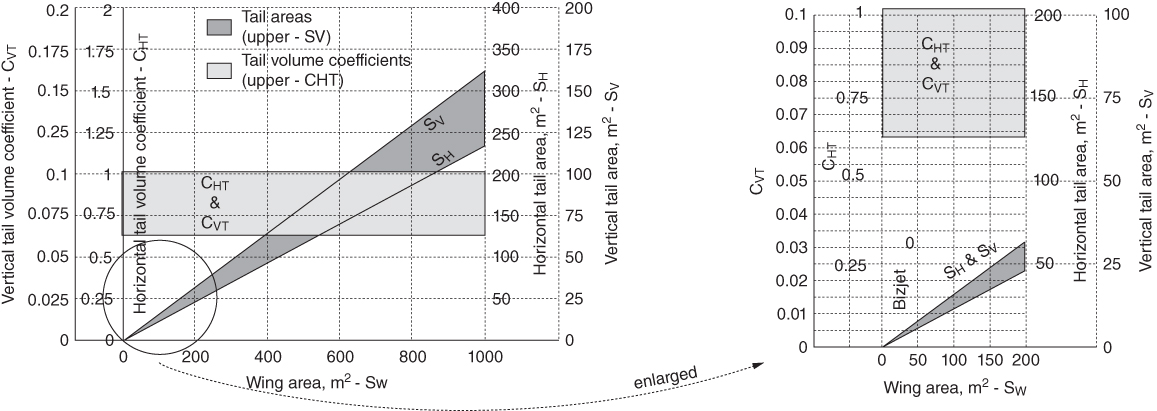
Figure 7.8 Statistics of tail volume coefficients.
Statistics show large spread in the values of SH and SV with respect to wing area, SW. Figure 7.8 shows growth for H‐tail and V‐tail surface areas with the wing area, SW. Reference [2] is the best source to get accurate data on SH and SV, these are included in Figure 7.8. However, [2] does not give the tail volume coefficients CHT and CVT. These will have to be laboriously computed from the three‐view diagrams given for the aircraft. This can be done with reasonable accuracy if the drawings are enlarged, the drawing scale can be determined from the linear dimensions; for example, wing span, fuselage length and so on. There is a large discrepancy in the CHT and CVT values as shown in the band in Figure 7.8. The same pattern can be observed in [1] of a large number of aircraft data given for older aircraft. Other good sources of aircraft statistics are found in [3, 4] and the websites listed in (Websites: (i) http://richard.ferriere.free.fr/3vues/; Specifications of F‐22 (F/A‐22), www.f22fighter.com/Specs.htm; Milavia, military aircraft; www.milavia.net/aircraft/; University of Southampton, Aircraft design resources; www.soton.ac.uk/∼jps7/AircraftDesignResources/LloydJenkinson%20data; Elsevier, Civil Aircraft Design, book website, http://booksite.elsevier.com/9780340741528/authors/default.htm; VRR, aircraft containers, https://vrr‐aviation.com/products/aircraft‐containers/; Searates, air cargo ULD containers, www.searates.com/reference/uld/)
Modern aircraft with fly‐by‐wire (FBW) technology can operate with more relaxed stability margins, especially for military designs, and hence require smaller empennage areas compared with older conventional designs (see Figure 12.18). It is suggested that readers make a separate plot to generate their own aircraft statistics at a better resolution for the particular class of aircraft in which they are interested in order to obtain an appropriate average value.
Typically, for civil aircraft designs, the horizontal tail, SH, area is about 25–30% of the wing reference area, depending on the length of fuselage. For long, large aircraft, the vertical tail, SV, area is around ≈12–0.15% of wing reference area, SW. For long, large aircraft, the vertical tail area is around ≈12–0.15% of wing reference area, SW. For short aircraft, the vertical tail area is around ≈15–0.18% of wing reference area, SW. It is expected that readjustment of the V‐tail and adjustment to SV will be required. More detailed analyses are also expected to be carried out in the next design phase, Phase II.
In this book, the trim surfaces locations are earmarked and are not sized. Designers have to ensure that there is adequate trim authority (trim should not run‐out) at any condition. This is normally done in Phase II after the configuration is frozen.
7.4.8 Aircraft Lift to Drag Ratio (L/D) versus Wing Aspect Ratio (AR)
Equation (4.18) derives the expression for aircraft induced drag, CDi = (CL2/πAR), which contributes a significant part (as high as about a third) of aircraft total drag. The higher the AR, the lower the CDi. The aim is to design aircraft to have as high as possible lift‐to‐drag ratio (L/D).
One of the effective way is to have as high as possible AR the structural design consideration allows. High AR wings are more expensive to design and manufacture, hence they are more meaningful for fare earning transport aircraft. Fuel saving as a result of having lower drag soon offsets the incremental cost of manufacture. The following values given in Table 7.2 may be used in this book, which are typical in the class of aircraft.
Table 7.2 Aircraft lift to drag ratio versus wing AR.
| Aircraft category | Aspect ratio range (AR) | Lift to drag ratio range (L/D) |
| Propeller driven | ||
| Small aircraft (≈ < 0.3 Mach) | 5–7 (mostly rectangular) | 10–12 |
| Large aircraft (≈ < 0.5 Mach) | 6–8 (tapered wing dominates) | 12–14 |
| Jet propulsion (invariably with tapered wing and with some sweep) | ||
| Smaller aircraft (≈0.65 < Mach < 0.5) | 6.5–7.5 | 12–15 |
| Larger aircraft (≈ > 0.75 Mach) | 8–12 (tapered wing dominates) | 14–16 |
| Supersonic military aircraft | ||
| High sweep delta wing | 3–4 (tapered wing dominates) | 4–6 |
| Low sweep trapezoidal wing | 4–5 (tapered wing dominates) | 6–12 |

Figure 7.9 Total sea‐level static thrust versus MTOM. (a) Small aircraft, (b) mid‐size aircraft and (c) large aircraft.
There are exceptions and readers may examine such designs.
7.4.9 MTOM versus Engine Power
The relationships between engine sizes and the MTOM are shown in Figure 7.9. Turbofan engine size is expressed as sea‐level static thrust (TSLS) in the International Standard Atmosphere (ISA) day at takeoff ratings, when the engine produces maximum thrust (see Chapter 11). These graphs can be used only for preliminary sizing; formal sizing and engine matching are dealt with in Chapter 14.
Thrust loading (T/W), is defined as the ratio of total thrust (TSLS tot) of all engines to the weight of the aircraft. Again, a clear relationship can be established through regression analysis. Mandatory airworthiness regulations require that multiengine aircraft should be able to climb in a specified gradient (see Federal Aviation Administration (FAA) requirements in Chapters 14 and 15) with one engine inoperative. For a twin‐engine aircraft, failure of an engine amounts to a 50% loss of power, whereas for a four‐engine aircraft, it amounts to a 25% loss of power. Therefore, the T/W for a two‐engine aircraft would be higher than for a four‐engine aircraft.
The constraints for engine matching are that they should provide sufficient takeoff thrust to simultaneously satisfy the (i) field length specifications, (ii) initial climb requirements and (iii) initial high‐speed cruise requirements satisfying the market specifications. An increase in engine thrust with increase of aircraft mass is obvious for meeting takeoff performance. Engine matching depends on wing size, number of engines and type of high‐lift device used. Propeller‐driven aircraft are power rated in P per kilowatt (hp or shp), which in turn provides the thrust. Turboprops use power loading, P/W, instead of T/W.
Smaller aircraft operate in smaller airfields and are generally configured with two engines and simpler flap types to keep costs down. Figure 7.9a shows thrust growth with size for small aircraft. Here, thrust loading is from 0.35 to 0.45. Figure 7.9b shows midrange statistics, mostly for two‐engine aircraft. Midrange aircraft operate in better and longer airfields than smaller aircraft; hence, the thrust loading range is at a lower value, between 0.3 and 0.37. Figure 7.9c shows long‐range statistics, with some two‐ and four‐engine aircraft – the three‐engine configuration is not currently in use. Long‐range aircraft with superior high‐lift devices and long runways ensure that thrust loading can be maintained between 0.22 and 0.34; the lower values are for four‐engine aircraft.

Figure 7.10 Pilot cockpit.
7.5 Internal Arrangements of Fuselage – Civil Aircraft
This section covers the internal arrangements of civil aircraft fuselage, mainly on transport category. Military aircraft internal details are different and are dealt with in Section 7.8.
Internal fuselage details, as such, do not affect aircraft external geometry except the front fuselage to meet the requirements of flight deck dealt with in the next section. However, internal fuselage details affect aircraft weight, thereby requiring wing size to be resized. Therefore, it is worthwhile studying fuselage internal details in order to make arrangements to keep weight as low as possible to compete in the marketplace. In classroom project work, it is suggested to make space allocations for facilities layout in an intelligent manner complying with regulatory requirements.
7.5.1 Flight Crew (Flight Deck) Compartment Layout
The pilot flight deck, of course, is at the front‐closure end of the fuselage to provide forward vision. The maximum accommodation is two side‐by‐side, generously spaced seats; an additional crew member for larger aircraft is seated behind the two pilots (Figure 7.10). In the past, there were two flight crews to assist two pilots; today, with improved and reliable microprocessor‐based multi‐functional display systems, two flight crews have become redundant. There could be provision for one. The windscreen size must allow adequate vision (see Figure 7.10), especially looking downward at high altitudes, during landing and during ground manoeuvres.
The pilot's seat is standardised as shown in Figure 7.11, with generous elbowroom to reduce physical stress. The seat can also be made to recline.
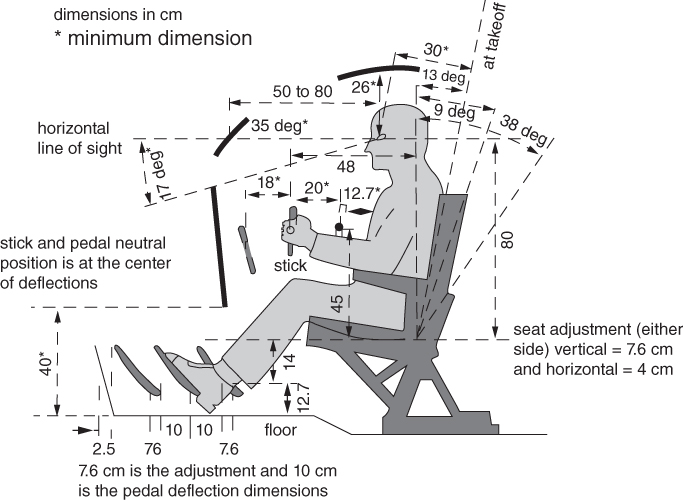
Figure 7.11 Standard pilot seat.
7.5.2 Cabin Crew and Passenger Facilities
Cabin seat arrangements are dealt with in Section 5.8. In this section, crew and passenger facilities are described. A vital fuselage design consideration is offering passenger services – the greater the passenger number, the more complex the design. This book does not cover details of interior design, a specialised state‐of‐the‐art feature that is more than the mere functionality of safety, comfort and efficient servicing. The aesthetics also offer an appealing and welcoming friendly environment to passengers. Physiological and psychological issues such as deep vein thrombosis, claustrophobia and fear of flying can be minimised through careful design of the seat‐pitch arrangement, window locations, environmental controls (i.e. pressurisation and air‐conditioning) and first‐aid facilities. Discussed herein are typical seat pitch, toilet and service‐galley arrangements in fuselage‐space management that contribute to fuselage length.
The minimum number of cabin crew is subjected to government regulations. No cabin crew is required for fewer than 19 passengers, but can be provided if an operator desires. For 19–29 passengers, at least one cabin crew is required. For 30 or more passengers, more than one cabin crew is required. The number of cabin crew increases correspondingly with the number of passengers.
7.5.3 Seat Arrangement, Pitch and Posture (95th Percentile) Facilities
Figures 7.12 and 7.13 illustrate typical passenger seating‐arrangement designs, which can be more generous depending on the facilities offered by the operator. Pitch is the distance between two seats and varies from 28 (tight) to 36 in. (good comfort). Seat and aisle width are shown in the next figure. Typically, seat widths vary from 17 (tight) to 22 in. (good comfort). Seats are designed to meet the 16‐g governmental impact regulations.

Figure 7.12 Passenger seat pitch.
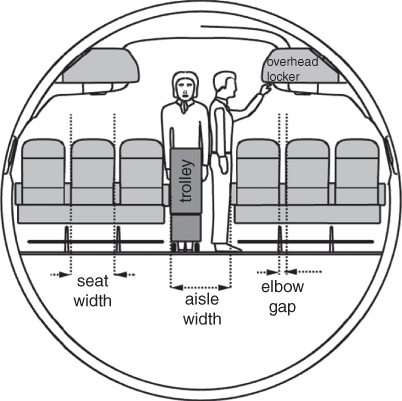
Figure 7.13 Passenger seat and aisle width.
Table 7.3 gives typical seat pitch, width and aisle width (there could be a variation of dimensions from operator to operator) as currently prevalent in service. There is flexibility build in to the design to convert seating arrangements, or even remove seats, as the market demands.
Table 7.3 Seat/aisle pitch and , inch (cm).
| Seat pitch | Seat width | Aisle width | |
| Economy class | |||
| Low comfort | 28 (72) | 18 (45.8) | 17 (43.2) |
| Medium comfort | 30 (76.2) | 19 (48.2) | 19 (48.2) |
| High comfort | 32 (81.2) | 20 (50.8) | 22 (56) |
| Business class | 34–36 (86.4–91.5) | 21–22 (53.4–56) | 23–25 (58.4–63.5) |
Smaller aircraft with fewer passengers (i.e. up to four abreast at the lower mission range) can have a narrower aisle because there is less aisle traffic and service. For larger aircraft, the minimum aisle width should be at least 22 in. (Figure 7.13).
Recently, some operators have offered sleeping accommodation in larger aircraft for long‐range flights. This is typically accomplished by rearranging cabin space – the interior securing structure is designed with flexibility to accommodate changes.
7.5.4 Passenger Facilities
The typical layout of passenger facilities is shown in Figure 7.14 and includes toilets, service galleys, luggage compartments and wardrobes. Cabin crew are provided with folding seats, for large aircraft these are conveniently located as normal seats.
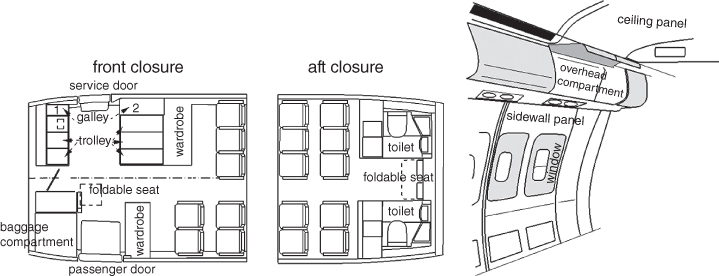
Figure 7.14 Passenger facilities.
The type of service depends on the operator and ranges from almost no service for low‐cost operations to the luxury of first‐class service. Figure 7.15a illustrates a typical galley arrangement for a midrange passenger‐carrying aircraft; other types of server trolleys are also shown. Figure 7.13 shows a trolley in the aisle being pushed by cabin crew.

Figure 7.15 Passenger facilities. (a) Typical galleys with service trolley and (b) typical toilet arrangements.
Galleys are located in the passenger cabin to provide convenient and rapid service. Generally, they are installed in the cabin adjacent to the forward‐ and aft‐galley service doors. Equipment in the galley units consists of the following:
- high‐speed ovens: refrigeration
- hot‐beverage containers: main storage compartments
- hot‐cup receptacles
The electrical control‐panel switches and circuit breakers for this equipment are conveniently located. Storage space, miscellaneous drawers and waste containers are also integrated into each galley unit.
Figure 7.15b shows a typical toilet arrangement for larger passenger‐carrying aircraft. For a small Bizjet class, the toilet can be minimised (or removed – not preferred) unless there is a demand for a luxury facility.
7.5.5 Doors – Emergency Exits
FAA/Civil Aeronautics Agency (CAA) has mandatory requirements on minimum number of passenger doors, their types and corresponding sizes depending on the maximum passenger capacity the fuselage intended to accommodate. This is to ensure passenger safety – certification authorities stipulate a time limit (90 s for big jets) within which all passengers must egress if an unlikely event, for example fire, occurs. The larger the passenger capacity, the larger the number is of the minimum number of doors to be installed. Not all doors are of the same size – the emergency doors are smaller. All doors are kept armed during airborne operation.
An emergency situation (say from fire hazard, ditching on water or land etc.) would require a fast exit from the cabin to safety. FAA initially imposed a 120 s egress time but from 1967 this changed to a maximum of 90 s. This was possible through the advances made in /chute technology. To obtain airworthiness certification, aircraft manufacturers have to demonstrate by conducting simulated tests that complete egress is possible within 90 s. European Aviation Safety Agency (EASA) has similar requirements.
FAR25 Section 25.783 gives the requirements for the main cabin doors and Section 25.807 for the emergency exit doors. There are several kinds of emergency exit doors given in Table 7.4 (all measurements are in inches). All are rectangular in shape with a corner radius. The sizes are the minimum and designers can make them bigger. The oversized doors need not be rectangular so long they can inscribe the minimum rectangular size.
Table 7.4 Aircraft door types.
| Position | Minimum height (inch) | Minimum width (inch) | Maximum corner radii (inch) | Passenger numbera | |
| Type A | Floor level | 72 | 42 | 7 | 110 |
| Type B | Floor level | 72 | 32 | 6 | 75 |
| Type C | Floor level | 48 | 30 | 10 | 55 |
| Type I | Floor level | 48 | 24 | 8 | 45 |
| Type IIb | Floor level | 44 | 20 | 7 | 40 |
| Type III | Over wing | 36 | 20 | 7 | 35 |
| Type IV | Over wing | 26 | 19 | 6.3 | 9 |
aThe types of doors are related with the minimum number of passengers carried. The higher the number of passengers, the larger is the door size.
bIf Type II is located over the wing then it can have inside step up of 10 in. and outside step down of 17 in.
All doors except Type III (inside step up of 20 in. and outside step down of 27 in.) and Type IV (inside step up of 29 in. and outside step down of 36 in.) are from floor level. If a Type II is located over the wing then it can have an inside step up of 10 in. and an outside step down of 17 in. Emergency doors are placed at both the sides of the aircraft and need not be diametrically opposite, but they should be uniformly distributed (no more than 60 ft away), easily accessible for even loading by passengers when it is required. Safety drill by cabin crew is an important aspect to save lives and all passengers must attend the demonstration, no matter how frequent a flier one is. From type to type there are differences.
There should be at least one easily accessible external main door. The combination of main doors and emergency doors are at the discretion of the manufacturers who will have to demonstrate evacuation within the stipulated time. Fuselage length would also decide the number of emergency doors as they should not be spaced more than 60 ft away. Table 7.5 gives the minimum number of emergency doors. It is recommended that more than minimum provision is to be made. Types A, B and C can also be used – they are deployed in larger aircraft.
Table 7.5 Aircraft emergency door types.
| Number of passengers | Minimum size emergency door type | Minimum number of emergency doors |
| 1–9 | Type IV | One in each side of the fuselage |
| 10–19 | Type III | One in each side of the fuselagea |
| 20–40 | Type II | Two in each side of the fuselage a |
| 41–110 | Type I | Two in each side of the fuselage |
| >110 |
aOne of them could be of one size smaller.
There could be other types of doors, for example, a door at the tail cone, ventral doors and so on (dimensions are given in Table 7.6). Flight crew emergency exit doors are separately provided at the flight deck.
Table 7.6 Door dimensions.
| Step height inside (outside) (inch) | Minimum height (inch) | Minimum width (inch) | Maximum corner radii | |
| Ventral | – | ≥48 | ≥24 | 8 |
| Tail cone | 24 (27) | 42 | 72 | 7 |
7.5.6 Cargo Container Sizes
As the fuselage diameter increases with passenger load, the under‐floorboard space can be used for cargo and baggage transportation. With operating costs becoming more competitive, the demand for cargo shipment is increasing, to the extent that variant aircraft are being designed as cargo aircraft (e.g. no windows and a lower level of cabin pressurisation). An attractive variant is the ‘combi’ design, which can convert the cabin layout according to the sector payload, in which the passenger load is smaller and the cargo load is higher. The combi layout can quickly reconfigure the cabin interior for passengers in the forward part and cargo in the rear, which facilitates passenger loading and unloading through the front door.
Cargo and baggage could be handled more efficiently by keeping items in containers (Figure 7.16) and having both destination and interior‐space management. At the destination, the entire container is unloaded quickly so the aircraft is free for quick turnaround utilisation. Container sizes are now standardised to fit in the fuselage and are internationally interchangeable.
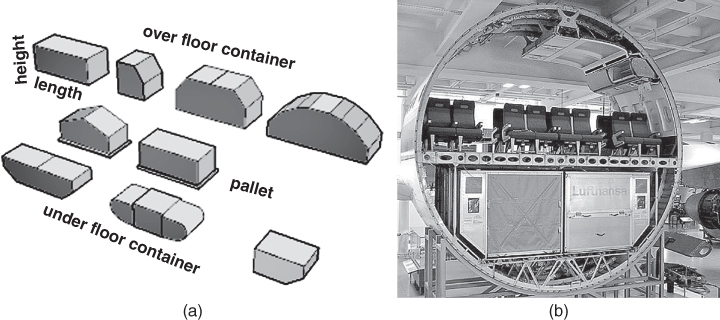
Figure 7.16 Standard containers. (a) Typical container shapes and (b) LD3 container in A300. Credit ‐ Airbus
The term unit load device (ULD) is commonly used when referring to containers, pallets and pallet nets. The purpose of the ULD is to enable individual pieces of cargo to be assembled into standardised units to ease the rapid loading and unloading of aeroplanes and to facilitate the transfer of cargo between aeroplanes with compatible handling and restraint systems.
Those containers, intended for below‐floorboard placement (designated larger container, load device: LD), need to have the base smaller than the top to accommodate fuselage curvature. Those containers have rectangular cross‐sections and are designated ‘M’. Figure 7.16 shows typical container shapes; Table 7.7 lists standard container sizes, capacities (there are minor variations in dimensions) and designations.
Table 7.7 Standard container sizes and capacity, dimensions in cm (IATA designation not given).
| Type | Length, cm | Width, cm | Height, cm | Base‐length, cm | Capacity, kg | Volume, m3 |
| LD1 | 228 | 145 | 162.6 | 147 | 1588 | 5.8 |
| LD2 | 156.2 | 153.4 | 162.6 | 119.2 | 1225 | 3.4 |
| LD3* | 200.7 | 153.4 | 162.6 | 157.2 | 1588 | 5.8 |
| LD4 | 244 | 153.4 | 162.6 | 244 | 2450 | 6.1 |
| LD6 | 406.4 | 153.4 | 162.6 | 317.5 | 3175 | 8.8 |
| LD7 | 317.5 | 223.5 | 162.5 | 317.5 | 4627 | 9.91 |
| LD8 | 317.5 | 153.4 | 162.5 | 243.8 | 2449 | 6.94 |
| LD11 | 307 | 145 | 162.5 | 307 | 3176 | 7 |
| LD 26 | 400 | 214 | 162.5 | 307 | 6033 | 12 |
| M1 | 318 | 224 | 224 | 318 | 6804 | 17.58 |
| PGA pallet | 608 | 244 | 244 | 608 | 11 340 | 36.2 |
Note: IATA = International Air Transport Association.
The LD3 container in Airbus300 below the floorboard is shown in Figure 7.16b.
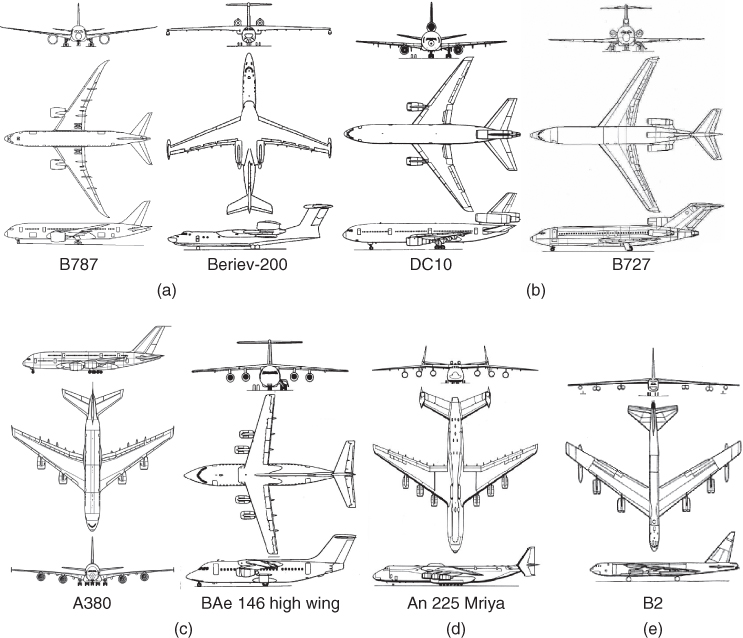
Figure 7.17 Options for conventional civil aircraft nacelle positions. (a) Two, (b) three, (c) four, (d) six and (e) eight engines.
Source: Reproduced with permission from Ferrier.
7.6 Some Interesting Aircraft Configurations – Civil Aircraft
In addition to the many different types of aircraft configurations, including some old unusual types, shown in Chapters 4–6, a few more larger types of civil aircraft configuration are shown in Figure 7.17 that are worth studying. These are grouped by the number of engines installed.
- Two engine. The first one is the latest wide bodied B787 with conventional low wing configuration with two under‐slung turbofans. The second one is the Beriev 200 high wing aircraft with two high fuselage mounted turbofans, a configuration that suits flying boats keeping the engine intake protected from water spray.
- Three engine. The two well proven world's largest trijet configurations. The first one, the Douglas DC10 with a straight intake centre engine. The second one, the Boeing 727 with an S‐duct intake centre engine. These are no more in production but few are still operating.
- Four engine. The first one is the world's largest passenger aircraft, the Airbus380, carrying commercial jet transport aircraft. The second one is one of the few bigger high wing commercial jet transport aircraft.
- Six engine. The world's largest cargo carrying commercial jet transport aircraft, An225, is another example of the few bigger high wing jet transport aircraft.
- Eight engine. The world's largest military aircraft, B2, serving the US Air Force for more than half a century.
Interestingly, a seven engine (piston engine) Russian design of the 1930s was the Kalinin K‐7. Currently, with the advent of electric powered aircraft, a large number of distributed engine concepts are gaining ground. The over wing pod‐mounted Honda Jet and slipper‐nacelle design YC 14 Boeing STOL aircraft are shown in Figure 5.24.
The engines on single‐engine aircraft are at the centreline (except on special‐purpose aircraft), mostly buried into the fuselage. If propeller driven, an engine can either be a tractor (i.e. most designs) or a pusher‐propeller mounted at the rear.
Some unconventional futuristic nacelle design options are shown in Figure 7.18. These are proposed designs yet to be built. Figure 7.18a shows the Boeing Super Cruiser and Figure 7.18b is the Silent aircraft BWB proposal by MIT and Cambridge Universities.

Figure 7.18 Futuristic options for nacelle position. (a) Futuristic rear engine mount, (b) BWB rear engine mount, (c) wing‐tip mounted engines and (d) twin on fuselage.
Source: Reproduced with permission from Cambridge University Press.
Virginia Polytechnic Institute (VPI) conducted studies on interesting aircraft configurations with potential. Through their multidisciplinary optimisation (MDO) studies of high‐subsonic aircraft with engines at the tip of a strutted wing (Figure 7.18c), they found better weight and drag characteristics than in conventional cantilevered designs [5]. Although the studies have shown some merit, there are some critical issues yet to be considered; more detailed analyses are required to offer better resolution. The structural weight gain due to a truss‐supported wing and the aerodynamic gain due to induced drag reduction with the possibility of having a high aspect ratio wing and from the wing‐tip engines are to be studied in trade‐off studies. A major concern will be to satisfy the mandatory requirement of a one‐engine inoperative case. This will result in a considerably larger tail, possibly divided in half, depleting some weight benefits. Cost of production is another factor: studies must ensure there are economic gains after all these considerations. The new aircraft certification will further add to the cost. The proposed aircraft is likely to be more expensive, which may erode the DOC gains. Until more details are available, the authors do not recommend the wing‐tip mounted engine installation, especially during an introductory course. Engines should be kept close to the aircraft centreline but away from any wake effects. The nose‐wheel spray may require the nacelle to be at least 30°, away from the nose wheel (see Chapter 5). Detailed sensitivity studies are required for comparative analyses of this novel configuration when a simple winglet provides induced drag reduction. However, VPI's study of twin side‐by‐side engines between the canted vee‐tail (Figure 7.18d) shows promise and concluded that it would be better with a winglet.
7.7 Summary of Civil Aircraft Design Choices
This section summarises some of the information discussed in Sections 7.5 and 7.6. The eight graphs shown in Figures 7.2--7.9 capture the actual aircraft data from Jane's All the World's Aircraft Manual [1] and other sources. These statistical data (with some dispersion) prove informative at the conceptual design stage for an idea of the options that can be incorporated in a new design to stay ahead of the competition with a superior product. It is amazing that with these eight graphs the reader can determine what to expect from a customer's (i.e. operator) specification on its payload range. Readers may have to wait until their project is completed to compare how close it is to the statistical data, but it will not be surprising if the coursework result falls within the statistical envelope. Civil aircraft layout methodology is summarised as follows:
- Size the fuselage for the passenger capacity and the amenities required from the customer's specification. Next, ‘guesstimate’ the MTOM from Figure 7.2 (i.e. statistics) for the payload range.
- Select the wing planform area from Figures 4.23, 7.5 and 7.7 for the MTOM. Establish the wing sweep, taper ratio and t/c for the high‐speed Mach‐number capability.
- Decide whether the aircraft will be high wing, mid‐wing or low wing using the customer's requirements. Decide the wing dihedral or anhedral angle based on wing position relative to the fuselage. Decide on the twist.
- Estimate H‐tail and V‐tail sizes for the wing area from Figure 7.9.
- Guesstimate the engine size for the MTOM from Figure 7.10. Decide the number of engines required. For smaller aircraft (i.e. baseline aircraft for fewer than 70 passengers), configure the engines aft‐mounted; otherwise, use a wing‐mounted podded nacelle.
The industry expends enormous effort to make reality align with predictions. Industries have achieved performance predictions within ± 3% for the smaller aircraft and within ±1.5% for the bigger aircraft. The generic methods adopted in this book are in line with industry; the difference is that industry makes use of more detailed and investigative analyses to improve accuracy in order to remain competitive. Industry could take 10–20 man‐years (very experienced) to perform a conceptual study of midsized commercial aircraft using conventional technology. In a classroom, a team effort could take about one man‐year (very inexperienced) to conduct a concise conceptual study. There may be a lower level of accuracy in coursework, yet learning to design aircraft in this way is close to industrial practices.
It is interesting to observe that no two aircraft or two engines of the same design behave identically in operation. This is primarily due to production variances within the manufacturing tolerance allocations. The difference is minor: The maximum deviation is on the order of less than ±0.2%. An older aircraft would degrade in performance. During operation, the aircraft surface becomes deformed, dented, warped and/or contaminated causing viscous drag increase and so forth. Manufacturers consider these operational problems by maintaining a record of performance of all aircraft produced. Manufacturers' performance guarantees cover average aircraft degradation only up to a point. In other words, like any product, a brand new aircraft generally would perform slightly better than indicated in the pilot's manual – and this margin serves the operators well.
If a new design fails to reach the predicted value, who is at fault? Is the shortcoming originating from the aircraft or from the engine design or from both? Is it a bad aircraft or a bad engine (if a new engine design is incorporated)? Over time, the aerospace industry has successfully approached these issues. As mentioned previously, some aerospace stories could be more exciting than fiction; readers may examine some old design cases. Today, engine and aircraft designers work cooperatively to identify the nature of and then repair shortfalls.
The compressibility effect of the airflow influences the shaping of an aircraft. Airflow below Mach 0.3 is negligible. In this speed range, all aircraft are propeller driven (mostly piston engine powered). From Mach 0.3–0.6, the compressibility effect gradually builds up but can be ignored without losing performance degradation. Turboprops are effective up to Mach 0.5. Above Mach 0.6, the aircraft component geometry caters to compressibility effects. Jet propulsion with reactionary thrust becomes more suitable above Mach 0.6. Therefore, the aircraft component configuration is divided into two classes: (i) one for flying below Mach 0.5 and (ii) one for flying above Mach 0.6. A carefully designed turboprop can operate at up to Mach 0.6, with the latest technology pushing towards Mach 0.7.
MILITARY AIRCRAFT
7.8 Military Aircraft: Detailed Classification, Evolutionary Pattern and Mission Profile
Military aircraft statistics and geometric details need to be looked into from a different angle on account of a very different mission role. Combat aircraft do not have passengers and the payloads have wide variation in expendable armament type, mostly carried externally and in some designs also internally. Their operational roles are extremely varied as listed next. The difference between civil and military aircraft design is compared in Table 1.2 (Section 1.9). A preliminary classification of military aircraft is given in Table 1.1 in Section 1.3.1, consisting of fighters, bombers, reconnaissance, transport aircraft and so on. From time to time, depending on the perceived combat, the mission requirements get closer look to arrive at specific roles, nevertheless it has to be borne in mind that there is considerable overlap in the functional capabilities between different roles. Subdivision of the fighter role has many classifications. A multi‐role big combat aircraft (F14 ∼ 33 000 kg) can be used in air‐to‐air combat as well as for interdiction precision bombing at specific targets, for example, enemy radar stations and so on. On the other hand, an air superiority role (F16 ∼ 16 500 kg) calls for light agile aircraft mostly in defence roles to destroy enemy aircraft. A heavy bomber aircraft like the B52 would operate as strategic bomber with little high ‘g’ manoeuvre. The modern B2 bomber has stealth features to penetrate deep into enemy territories, but not much was known about its all‐round capabilities up until now. In the following are the typical terminologies for various kinds of combat aircraft in use.
- Combat Category
- Air superiority. Its role is to prevent enemy aircraft retaliation over the battlefield in enemy territory so that ground attack aircraft can carry out their tasks to disable adversary. The aircraft should be very agile in order to carry out air‐to‐air combat in beyond visual range (BVR) capability. As it has to fly longer distances into enemy territory and loiter in the vicinity in preparedness, it is a relatively heavier aircraft.
- Air defence. Its role is to prevent enemy aircraft gaining any superiority of the home sky. It has to out‐manoeuvre the best of adversaries. Air defences are smaller, lighter and very agile and primarily meant for air‐to‐air combat with BVR capabilities. This requires rapid response.
- Ground attack aircraft. This caters for the tactical and other specific requirements on the battlefield. It is capable of a close air support (CAS) role (see next).
- CAS. Air to ground support (gun/missile/light bombs) on the battlefield. It is a relatively lighter aircraft, highly manoeuvrable and could be slower compared to the ground attack type. Rapid fire gunships are a variant of CAS.
- Deep air support (DAS – Interdiction). Carries heavier bombs, jdams for precision bombing in the battlefield. It has a deep penetration capability into enemy territory.
- Multi‐role fighter. Heavier aircraft capable of performing a variety of combat, for example, air superiority, air defence, ground attack, interdiction and so on.
- Advanced tactical support (ATF). The F22 aircraft clearly illustrates the long‐range air superiority mission that was envisaged for penetrating deep into enemy airspace to destroy enemy air defence aircraft and to disrupt offensive air operations. This is advanced tactics with multi‐role capability – hence it is the new class.
- Strategic bombing. Carpet bombing: (B52 class).
- Surveillance Category
- Maritime patrol. Has a special role to cover threats from oceans (e.g. anti‐submarine role). In addition, they do surveillance and patrolling with long endurance flying.
- Reconnaissance. Very high‐performance aircraft beyond missile range (SR71, U2). Photographs enemy territory.
- Airborne early warning (AEW). This is capable of early detection of threats with long‐range sensors.
- Electronic warfare (EW). Capable of electronic counter measures. Remotely piloted vehicles (RPVs) are playing an increasing role in EW.
- Transport Category
- Military transport aircraft. To serve the logistical requirements, for example, troops, equipment ferry and so on (C17 type).
- Air‐to‐air refuelling. Larger tanker aircraft for mid‐air refuelling (K135 type).
- Training Category
- Military pilot training. These are specific types of training aircraft of normally two or three types leading up to advanced combat training ready for operational conversion. Its single‐seat variant can serve in a CAS role.
- Remotely Controlled Category
- Unmanned Aerial Vehicle (UAV)/ Unmanned Aircraft System (UAS)/RPV. These have no onboard pilots and are increasingly appearing on the battlefield in various roles: they could one day replace advanced manned combat aircraft.
In summary, the combat mission roles are varied as listed, but it can be compressed in to the following basic three types.
- Air defence. Adequately armed (all missiles) but low range (say around 500 nm range – larger country) to keep it light for maximum agility, operating within their own (friendly) territory to defend from invading aircraft. The maritime attack role can be included in this class as aircraft carrier ships can come closer to the target zone in an enemy country.
- Deep penetration‐multi‐role. This covers everything as listed in the combat category given before, except bomber and air defence. The longer ranges are currently limited to the order of 1000–2000 nm (crossing into enemy territory) but payload (combination of missiles and special‐purpose bombs) varies according to the specific mission. All except for the CAS role have supersonic capability.
- Interdiction. Bombers are slower (except the B1) carrying a large bomb load for longer distances.
For ferrying, drop tanks filled with fuel are slung at the hard points to increase range that can be in excess of twice more than the range given in Figure 7.22. Mid‐air refuelling would extend range capability and it could be carried out more than once.
The reality is that capabilities are a good measure of intent, it is unrealistic to assume that any nation will expend vast sums of money to acquire specific weapons systems without seeing how that expenditure will further national interests. Long‐range air superiority aircraft, such as the Phantom F4/Hornet F18/F35, have served a clearly defined role, offensive strategic air war, in their times.
A quick review of the post‐World War II fighter aircraft evolutionary pattern shows rapid progress in speed‐altitude and manoeuvre capabilities reflecting distinct changes that have taken place in fighter aircraft configuration. Examples of a few strikingly older designs are given in [1] and also can be found at various websites (Websites: (i) http://richard.ferriere.free.fr/3vues/; Specifications of F‐22 (F/A‐22), www.f22fighter.com/Specs.htm; Milavia, military aircraft; www.milavia.net/aircraft/; University of Southampton, Aircraft design resources; www.soton.ac.uk/∼jps7/AircraftDesignResources/LloydJenkinson%20data; Elsevier, Civil Aircraft Design, book website, http://booksite.elsevier.com/9780340741528/authors/default.htm; VRR, aircraft containers, https://vrr‐aviation.com/products/aircraft‐containers/; Searates, air cargo ULD containers, www.searates.com/reference/uld/), the list is too large to include here – key words prove sufficient to locate them if they are still online.
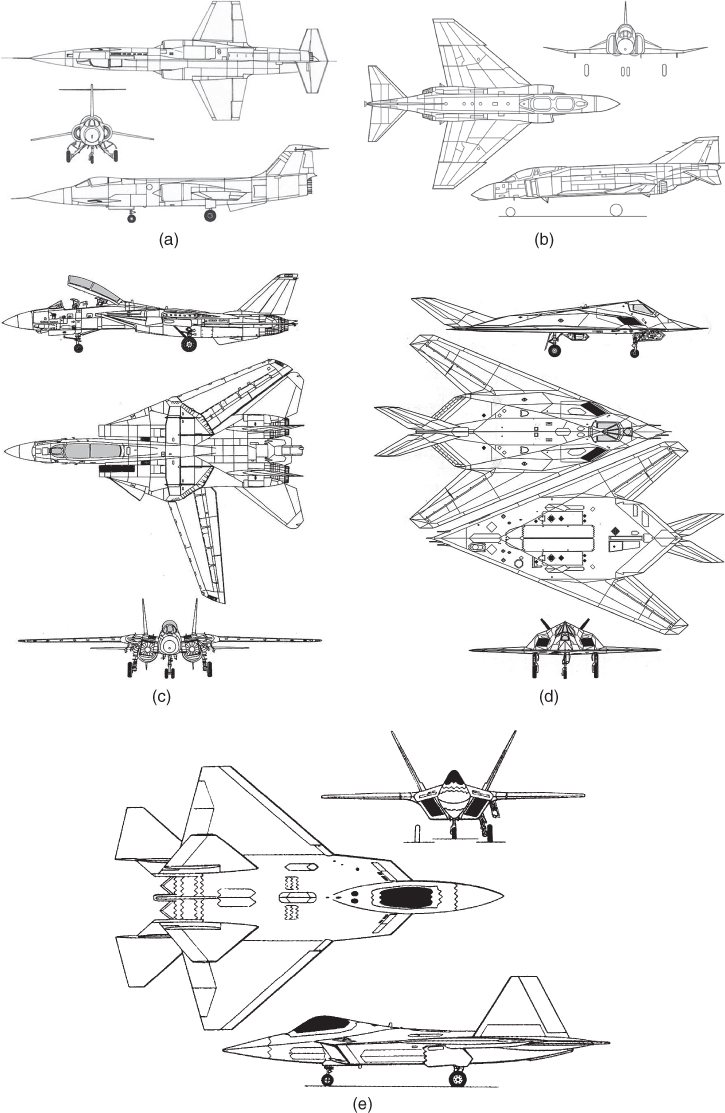
Figure 7.19 Chronology of fighter aircraft design evolution (USA). (a) 1950s–1960s: Lockheed F104, Starfighter. (b) 1960s–1970s: McDonnell F4, Phantom. (c) 1970s–1980s: Grumman F14, Tomcat (Swing wing design). (d) 1980s–1990s: Northrop F117 Nighthawk (the first all‐stealth design). (e) Twenty‐first century: Lockheed F35 (stealth design).
Source: Reproduced with permission from Ferrier.

Figure 7.20 Military aircraft wing planform shapes.
Source: Reproduced with permission from Ferrier.
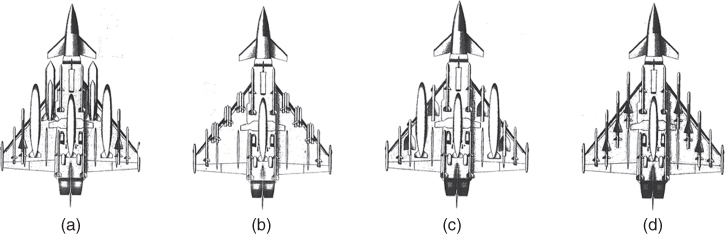
Figure 7.21 Typical multi‐role missions (Ref. [1]). (a) Air interdiction, (b) close air support, (c) air defence and (d) maritime attack.
Source: Reproduced with permission from Cambridge University Press.
Mission profile has a major contribution in shaping of military combat aircraft. An ultimate supersonic air superiority aircraft configuration would be quite different from the subsonic close air support type of aircraft configuration. Attempts are made here to offer a broad‐based coverage for an introductory course. Configurations in Figures 7.20 and 7.21 cover the major types of aircraft in operation. These would prove sufficient examples to study for an introductory course. Abundant three‐view diagrams (Figures 7.27–7.28, later) and photographs of many kinds of military aircraft are given in this book.
The US designs dominated the scene compared to the designs of other origins. There are successful European designs. The Cold War produced fine Russian designs. Some of the Russian aircraft capabilities are yet to be surpassed. Out of many, some of the outstanding US designs serving the last five decades are shown in Figure 7.21, most of them have proven their performances in various battlefields.
The F‐117A Nighthawk (Figure 7.19d) is the world's first operational aircraft specifically designed to exploit low‐observable stealth technology. The unique design of the single‐seat subsonic F‐117A provides exceptional combat capabilities. It is about the size of an F‐15 Eagle and has quadruple redundant FBW flight controls. The F‐117A can employ a variety of weapons and is equipped with sophisticated navigation and attack systems integrated into a state‐of‐the‐art digital avionics suite that increases mission effectiveness and reduces pilot workload. Detailed planning for missions into highly defended target areas is accomplished by an automated mission planning system developed, specifically, to take advantage of the unique stealth capabilities. Section 22.8 briefly introduces the considerations for stealth design.
A civil aircraft operational evaluation (OP) is relatively simpler. Its DOC can be compared with the competitor to assess the viability of design. On the other hand, a military aircraft comparison is based on several criteria; for example, operation, technology, survival, cost, disposal and political. Each war has taught lessons on how factors other than purely technical and operational capability override decision for the next generation designs. The weapon capability is integral to aircraft capability and therefore the design procedure has to bear in mind the kind of weapon integration envisaged.
Typical combat aircraft design considerations include the following – they cover a lot more disciplines than the civil aircraft design.
- Number of crew. Heavy workload could demand twin crew – 9‐g physical limit.
- Sizing. Wing loading and thrust loading, control configured sizing.
- Number of engines. Survivability consideration could demand twin engines.
- Engine. Selection for matching capabilities, vector trust and so on.
- Structure. Choice of material, manufacturing philosophy.
- Operational strategy. Air‐to‐Air Combat/Air to Ground Combat and so on.
- Configuration. Stealth, external hard points for weapon/drop tank and so on.
- Performance. Agility, speed, altitude, range, supercruise, STOL, survivability and so on.
- Electronics. Weapon system, communication, navigation, data acquisition, counter measures, EW and so on.
- Systems. FBW, Full Authority Digital Engine Control (FADEC), microprocessor‐based management and so on.
- Weapon. Type of weapon to be integrated.
- Life cycle. Cost/maintenance/logistics/disposal – support from ‘cradle to grave’.
Military aircraft mission profile is extremely varied and aircraft sizing depends considerably on the requirements to encounter perceived threats (there are a lot of unknowns about adversary capabilities). In addition, combat and survival considerations impose severe design constraints in shaping the aircraft, for example, incorporation of stealth, manoeuvre in relaxed stability (FBW) and so on. Inclusion of stealth and FBW features requires extended studies that would substantially exceed one term work. US universities could be in a position to obtain National Aeronautics and Space Administration (NASA) software to evaluate stealth. Other nations may not be that fortunate. Control‐configured FBW design would require the understanding of the control laws of relaxed stability manoeuvres that are not easy to size. A methodology to pursue these considerations in an undergraduate class could be carried out but the authors do not believe that it would do proper justice before the fundamentals are mastered. The F117 is an example of combat aircraft that incorporates stealth and FBW. It defies imagination coming closer to a ‘star wars’ shape – no wonder it was nicknamed aerodynamicist's nightmare. This kind of design would not prove easy for introductory classroom project work.
Typically, military aircraft structures demand extensive use of advanced materials, for example, used of composites, lithium and boron alloying with aluminium. Typically, some of the F22's external surfaces have 24% composite, 16% aluminium and some thermo‐plastic material. The Eurofighter uses more than half its weight as non‐metals.
A military aircraft design exercise would be incomplete without OP, which is beyond the scope of the book. In a true sense, it will require a twin dome (one flown by adversary) combat flight simulator, each flown by human pilots to assess performance capability. Here, a 100% rating means always win and 0% rating is always lose. An 80% capability can be expressed as 4 : 1 that is, in combat; one aircraft is lost against four enemy aircraft losses. Here too, the enemy aircraft and weaponry performances are based on considerable guesswork as potential adversaries are not going to declare their capabilities – it is a matter of life and death. A credible twin dome combat simulation is the nearest assessment platform designers can have – yet real life would still be different. A twin dome simulation could show significant differences in combat capability depending on the selection of weapon/system and so on. Aircraft performance capability is integral to the capabilities of the weapon system in use. In a swing role (combinations of both air‐to‐air and air to ground operations) the evaluation gets more complicated. Since today's combat would be BVR, a host of other external support systems (target acquisition) are required to assess the military aircraft design beyond making unusual shapes to reduce Radar Cross‐section Signature (RCS – low observable). If life cycle cost (LCC) is brought into evaluation then constraints through national economy are another consideration – can these be excluded from a credible teaching exercise?
Military transport design has similarities with commercial transport design, although their operational strategies are different. This book considers military transport aircraft design to be very similar to civil design, except that its certification standards are different (Milspecs).
7.8.1 Fighter Aircraft Generations
The post‐war period of development of aircraft production was marked by a scientific and technical revolution – the early era of jet aircraft. In the late 1930s, it became clear that ordinary planes with piston engines and propellers had been developed to almost its maturity and that there was not much room for further improvement unless new technologies could be implemented. Since WWII, with the introduction of the jet age, each successive generation of fighter has demonstrated increased speed and altitude compared to its predecessor, to provide a machine better adapted than that of any competitor to the needs of all potential customers.
In a way, post‐World War II fighter aircraft designs evolved in discrete steps of technological advancement and are typically categorised in terms of generation of design evolution, currently in five (or six) generations as follows (Figure 7.20).
- ‘Zeroeth’ generation (1945–1955). The ‘Zeroeth’ generation fighter aircraft were the first military aircraft using jet engines. A few were developed during the closing days of WWII but saw very limited combat operations. These include WWII era fighters such as the Me262 and early postwar aircraft such as the F‐80 and F‐84.
- First generation (1945–1955). The first generation can be split into two broad groups: (i) WWII era fighters such as the Me 262 (also Zeroeth generation) and (ii) the mature first‐generation fighters such as the F‐86 used in the Korean War. Mikoyan's design office worked on the twin‐engine fighter MiG‐9. Yakovlev's design office brought out the single‐engine fighter Yak‐15 in October 1945; it was already on the airfield for preliminary tests and for taxiing. The MiG‐9 and Yak‐15 promised to be lighter, easier to fly, to have better flying characteristics and be more reliable than the German planes. Examples of first generation jet fighters are the F‐84, F‐86 and F‐100.
- Second generation (1955–1960). The second‐generation fighter aircraft exhibit more advanced avionics, engines and used the first guided air‐to‐air missiles. The period from 1950 until 1955 is marked by a dearth of significant interceptor prototypes except for the 1953 appearance of the MiG‐17. Second‐generation aircraft – including the MiG‐19/21 and US century series fighters – were designed during the 1950s. Although they are still found in fighter inventories worldwide, older planes probably have limited combat potential when confronting more modern fighters, since they may suffer from several disadvantages. For example, they may carry less sophisticated munitions and have less capable sensors. The early MiG‐ and Su‐series aircraft have been improved in their air‐to‐air role. The MiG‐23 Flogger B was a second‐generation fighter that had a secondary ground attack capability greater than the Fishbed or Fitter.
- Third generation (1960–1970). The third‐generation fighter aircraft exhibit yet more advanced avionics, engines and weapons. The changes in the fighter combat conception, new air‐to‐air guided missiles and the results from first‐ and second‐generation fighter operations gave rise to the third generation, such as the later versions of the F104S and MiG‐23. Third‐generation aircraft may provide somewhat more military capability, especially if they have gone through extensive modifications since they were built. Designed during the 1960s through the1970s, this generation includes the MiG‐27 series designed by former Soviet Union's Mikoyan Design Bureau. The third‐generation fighter‐bombers and tactical bombers included the Su‐24 and their derivatives, the F‐4s and A‐7s built by the USA and the European designed Mirage 3, Mirage 5, F1 and Tornado.
- Fourth generation (1970–1990). The fourth generation continued the trend towards multi‐role fighters equipped with increasingly sophisticated avionics and weapon systems. These fighters also began emphasising manoeuvrability rather than speed to succeed in air‐to‐air combat. Fourth‐generation fighters, designed during the 1960s and 1970s, include the US‐designed F‐14, F‐15, F‐16 and F/A‐18; the Soviet‐built SU‐27 and MiG‐29 and the European Mirage 2000. Fourth‐generation aircraft usually have more sophisticated avionics than their predecessors, more powerful engines and are able to operate more capable missiles.
- Fifth generation (1990–2010). The fifth‐generation fighters use advanced integrated avionics systems to provide the pilot with a complete battlespace awareness, and use of low‐observable ‘stealth’ technology. The F‐22 and F‐35 were the first fifth‐generation US fighters, with Russia following with the Mikoyan Gurevich MFI prototype and the Sukhoi PAK‐T50 and China with the J‐20.
Making the situation even more confusing, the Chinese have their own particular order of ranking. The Chinese call the Russian fifth‐generation fighter a fourth‐generation machine.
The term ‘4.5 generation’ is also sometimes seen (the Chinese call them ‘3.5 generation’). These are more recent fourth‐generation fighters, retaining the basic characteristics of fourth‐generation planes but with enhanced capabilities provided by more advanced technologies that might be seen in fifth‐generation fighters. Good examples are the F/A‐18E/F Super Hornet, Eurofighter Typhoon and Dassault Rafale. All make use of advanced avionics to improve mission capability and limited stealth characteristics to reduce visibility when compared to older fourth‐generation aircraft.
Stealth characteristics markedly enhance the capability for survivable attack of defended targets. And that remains true, even though evolving modern air defences available on the international arms markets have increasing capability against currently deployed levels of stealth. Hence, to continue to operate effectively in the face of these defences, stealth has to be supplemented with other survivability features. Nonetheless, stealth aircraft operate at much lower levels of support than conventional aircraft and even small numbers of stealth aircraft can greatly leverage the capabilities of the remainder of the bomber force and of the tactical fighter forces.
Europe and Japan are behind in applied stealth technology as evidenced by US aircraft programmes such as the F22, B2 and F117A. Most of the applied foreign low‐observable work involves basic shaping, material coating techniques and signature testing requirements. Europe has been led by France, Sweden, Germany and the UK in various types and levels of low‐observable applications. Applications on fighter aircraft have generally been at fundamental applied levels, primarily using absorbent coatings, limited structural shaping and absorbent structure. Applications seem to be limited to the areas with highest signature return rather than application to an entire airframe. European firms are also working on stealth technology applications to cruise missiles and unmanned aerodynamic vehicles.
The rapid growth of a globalised economy has deepened the degree of international cooperation and expanded the variety of methods of cooperation in the international arms production industry to such an extent that a globalisation trend has also emerged in this field. The globalisation of the national defence industry refers to the change from the traditional preference for autarky to that of a globally oriented market in terms of research, production, management and sales. At present, there are mainly three ways in which globalisation exhibits itself. The first is through the purchasing of weapons from other countries and taking part in the production of these weapons (including granting of special permits, joint cooperation and development ventures and compensation trade). An example is the joint production of F16 fighter jets by USA, Holland, Denmark and Norway. The second method is through military cooperation packages covering weapons trade, production and maintenance and joint military exercises between different countries, for example, the signing of the 10‐year military cooperation agreement package between India and Russia in 1999. The final means is through cross‐border joint ventures and joint research and development projects between nations (including international group companies, international integration and transnational amalgamation). The four‐nation joint venture for the production of the Eurofighter‐2000 by the UK, Germany, Italy and Spain is an example.
7.9 Military Aircraft Mission
A typical mission profile for combat is given in Chapter 15. Figure 7.21 shows some configurations for the mission profiles to meet military aircraft mission demand, its range and armament payload are traded freely. A very high armament payload could be used for short ranges or lighter load for long‐range interdiction. A relatively light armament in air defence (high g manoeuvre) role can also be just overhead that is, low range while in escort role to a relatively long range. Military aircraft has in‐air refuelling capability (or use of drop tanks) to extend range. Payload mass has wide range of options – all hard points can have lighter weapons load or heavier missiles/bombs. In general, heavier aircraft will have a heavier payload. Payload being externally mounted on hard points means that aircraft drag characteristics alter substantially affecting range capability. At a design MTOM, what would be the payload would depend on mission range – here, weapon load and drop tank fuel load is traded. The B2 had to fly half the world (with mid‐air refuelling) to reach the target zone. It is for these reasons, a correlation like Figure 7.1 showing passenger versus range would not offer much information for military design. Unlike civil aircraft mission profile, it clearly indicates that the same class of military aircraft can have a wide variety of payload range. It may prove convenient to assess combat aircraft with full internal fuel for the payload‐range capability, quite different from what can be seen in Figure 7.1 for civil aircraft designs.
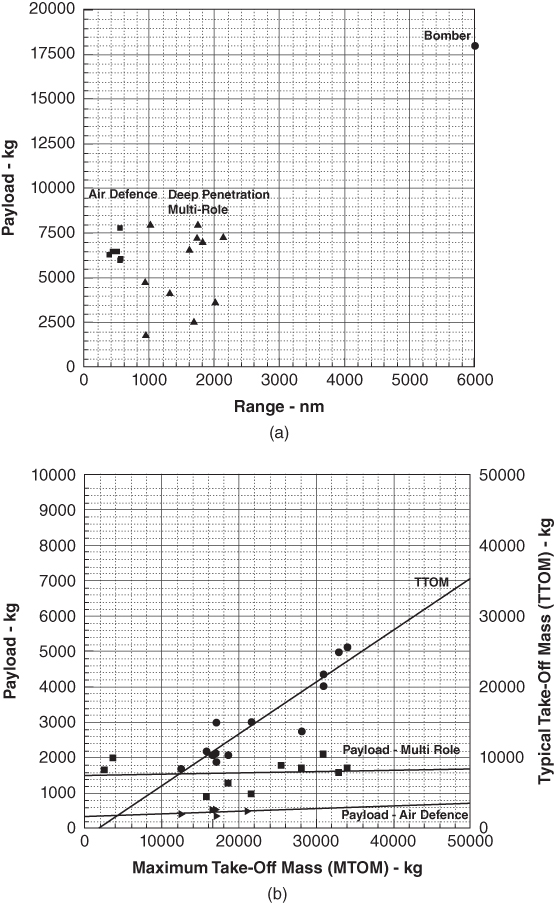
Figure 7.22 Military aircraft payload range (no drop tank or refuelling). (a) MTOM versus payload and (b) MTOM versus payload and TTOM.
The typical multi‐role armament configuration of Eurofighter is shown in Figure 7.21. In general, it consists of takeoff of heavily loaded aircraft, climb to altitude for programmed cruise that could have speed‐altitude specifically tailored for the terrain releasing weapon load and perceived threat, dive down to low level high‐speed dash to target zone for interdiction, then fast climb to extreme height of the lightened aircraft and return to base. For air defence, the combat would be in closer proximity to defend from attacking aircraft requiring extreme manoeuvre at high g.
7.10 Military Aircraft Statistics (Regression Analysis)
The statistics given in this chapter are from the following aircraft: B2, F14, F4, F15, F16, F18, F22, F35, F111. F117, SR71, SU37, MiG31, SU41, MiG25, Viggen, Rafale, Eurofighter, Gripen, Jaguar, Hawk, Mriage2000, Kfir, Lavi and Harrier.
In line with Section 7.5 on civil aircraft designs, this section gives the statistics of military aircraft weights and geometry. Unlike civil design progressing in an evolutionary track, the military designs tend to progress in revolutionary tracks. Military aircraft statistics are not as consistent as civil designs and require considerably more information for correlation. Military designs are operation‐specific and it would dilute its specialities if they were presented in a generic fashion. The author regrets to note that not much information is available in the public domain – understandably these are sensitive . The definition of various kinds of aircraft mass given in Figure 7.4 is applicable in this section – here payload replaces passenger capacity. To keep regression simple, linear fitment is carried out. The regression graphs given in this section can only be used for preliminary sizing.
Combat aircraft loading to MTOM would be at the sacrifice of its agility. Loading to MTOM is done when mission demands (several mission profiles are given in Chapter 13). In general, MTOMs are meant for deep penetration when considerable fuel is consumed before reaching the combat zone to make the aircraft lighter – it has option to carry the amount in drop tanks that can be jettisoned (punched out) when emptied to reduce drag. For maximum effectiveness with a balanced combat capability, military aircraft use lighter loading termed Typical Takeoff Mass (TTOM), which is typically 70% of MTOM.
7.10.1 Military Aircraft MTOM versus Payload
Figure 7.22 shows MTOM versus payload and TTOM. There is a distinct separation on armament loading capability between air defence class fighter aircraft with armament load of around 750 kg and the multi‐role class aircraft carrying nearly twice the payload for a longer distance. Air Defence class fighter aircraft are lighter than the multi‐role class aircraft. Understandably, in both the classes the MTOM grows with increase in payload (armament).
7.10.2 Military MTOM versus OEM
Figure 7.23 gives the relation between MTOM and OEM as well as the Operational Empty Mass Fraction (ratio of OEM to MTOM). OEM grows with growth in MTOM but there is a spread in the OEM fraction arising out of differing performance capabilities and system integration. Typically, the ratio of OEM/MTOM averages around 0.42–0.52.
7.10.3 Military MTOM versus Fuel Load, Mf
Since fuel load for combat aircraft is flexible depending on usage of drop tanks and air‐to‐air refuelling, onboard fuel content is taken as the standard condition to present the statistical analysis. Figure 7.24 gives the relationship between internal fuel load, Mf and fuel fraction, Mf/MTOM versus MTOM. There is some scatter on account of diversity in requirements.
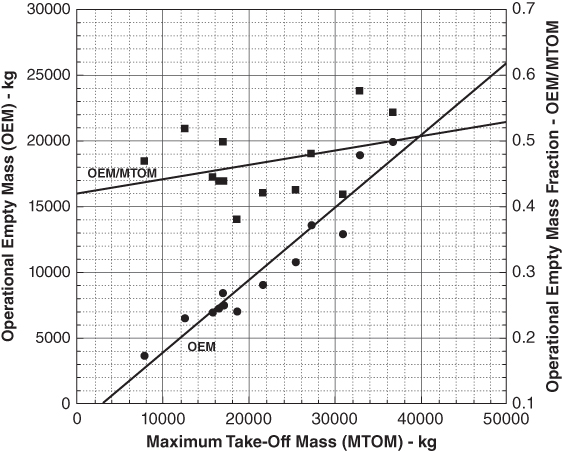
Figure 7.23 MTOM versus OEM.
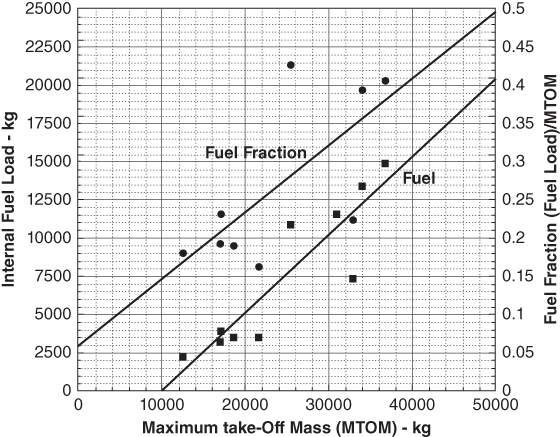
Figure 7.24 MTOM versus fuel load.
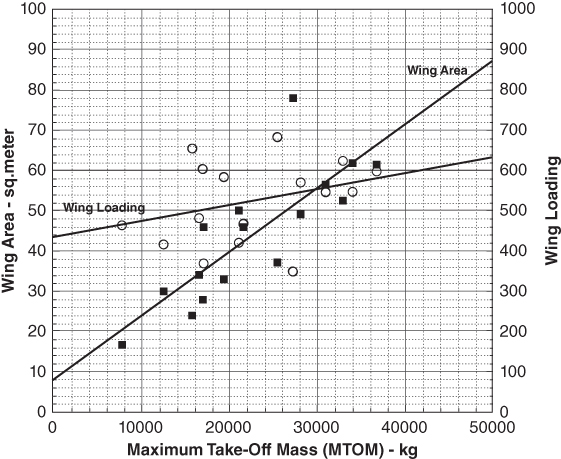
Figure 7.25 MTOM versus wing area.
Growth in MTOM would be associated with more fuel carrying capacity to meet range, but the fuel fraction graph shows dispersion on account of the difference in role, for example, short range air defence and longer range deep penetration types. Longer‐range aircraft would be heavier due to having to carry more fuel.
7.10.4 Military MTOM versus Wing Area
The influence of wing loading shows up in the graph (Figure 7.25). Military designs could have moderate wing loadings for hard manoeuvres. Modern designs show lower wing loading – the F22 has the low order of 350 kg m−2 compared to the Sepecat Jaguar with around 650 kg m−2. It will be seen in the next section that the F22 also has the highest thrust loading.
7.10.5 Military MTOM versus Engine Thrust
Combat aircraft are invariably powered by jet propulsion (turboprop driven CAS aircraft are few and are excluded in the statistics). Military aircraft would require very high thrust loading, T/W (could exceed 1), for manoeuvres and short field performance. A high thrust requirement is of a short duration and is met by augmenting thrust by the use of afterburners (Chapter 10).
Section 7.10 explains the need for TTOM for combat effectiveness. Figure 7.26 presents the relationship between total TSLS and the two types of aircraft mass, for example, MTOM and TTOM. Thrust increase is associated with aircraft mass increase. However, there is some spread in thrust loading. Typically, (total TSLS/MTOM) averages around 0.65 but (total TSLS/TTOM) exceeds 1. Later generations of combat aircraft have pushed thrust to weight ratio more than one would permit aircraft to accelerate in vertical climb. The F22 has the highest thrust loading as well as the lowest wing loading.
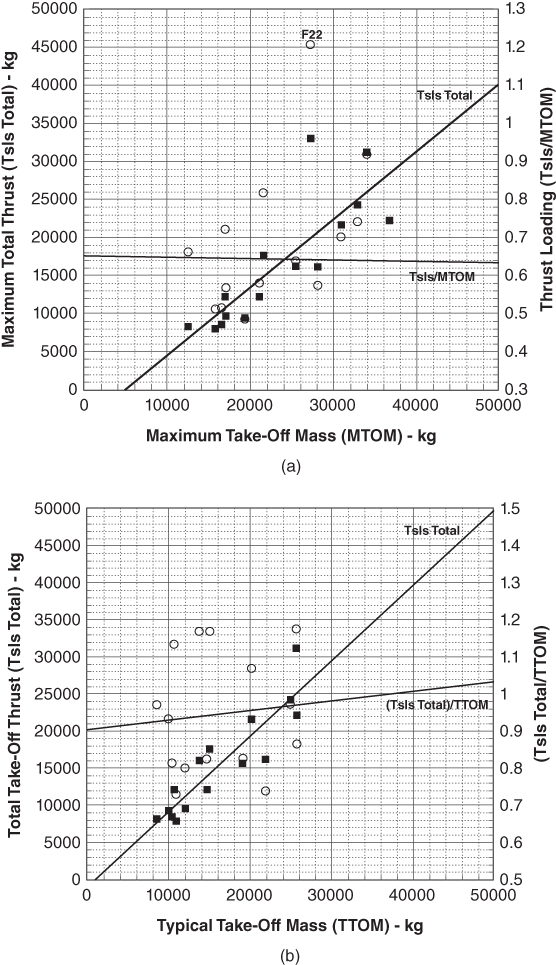
Figure 7.26 Aircraft weight versus total takeoff thrust. (a) Total thrust versus MTOM and (b) total thrust versus TTOM.
7.10.6 Military Empennage Area versus Wing Area
Military aircraft empennage configuration should be very different from civil aircraft design; many have a conventional design with an H‐ and V‐tail. On the other hand, an extreme example of the B2 appeared to not have any tail. Examining various configurations, it can be seen that there are several options for aircraft control.
Stability and control of modern combat aircraft are invariably supported by microprocessor‐based systems architecture such as FBW, when onboard computers continuously fly a slightly unstable aircraft under pilot initiated commands. This is beyond the scope of this book, so no statistical analysis could be presented here. The examples of the trainer class of aircraft would follow the conventional approach with a one H‐ and one V‐tail design (use Figure 8.5).
Military aircraft require more control authority for greater manoeuvrability and have shorter tail arms requiring larger tail areas. Typically, the horizontal tail area is about 30–40% of the wing reference area. The vertical tail area varies from 20 to 25% of the wing reference area. Supersonic aircraft have an all movable tail for control. If the V‐tail is too large then it is split into two.
7.11 Military Aircraft Component Geometries
Previous sections gave abridged statistical relations of weight and geometries for all categories of combat category aircraft. Section 2.3.3 gave some familiarisation of a typical military aircraft and its components – as mentioned earlier in a ‘Lego’ or ‘Mechano’ building block concept. Because of a large variety of combat mission profile and a large variety of technological options available, they result in wider choices to configure military aircraft. The choices are not made arbitrarily – strong reasons are associated. The following sections provide pertinent information on the (i) fuselage, (ii) wing, (iii) empennage and (iv) nacelle as military aircraft components. These four groups of aircraft component offer the preliminary shape of candidate combat aircraft configurations. Eventually, after the wing‐sizing and engine‐matching exercise, the choice for configuration must be narrowed down to one that would offer the best choice for the mission. Family derivatives of military aircraft are quite different, again depending on the mission role (e.g. use of additional crew, trainer version, carrier‐borne version, longer‐range version, improved variant version). Undercarriage information is presented separately in Chapter 9.
7.11.1 Fuselage Group (Military)
Unlike the approach to civil aircraft configuration, military design need not start with the fuselage, but it may prove convenient to do so. Fighter aircraft fuselage does not carry any internal payload – it has the singular function to accommodate the crew (or crews) and engine (or engines) along with routing of conduits of various systems (wires, pipes, linkages for the systems), fuel tanks and encasing small arms (e.g. guns). Unlike hollow civil aircraft fuselage, it is very tightly packed, minimising the fuselage volume requirement. With the engine (or engines) buried inside, air intake is an integral part of the fuselage. The large wing root of delta (or trapezoidal wing with strake) planform offers the scope to make the wing blend with the fuselage. In that case, the configuration of the wing becomes integral to configuring the fuselage, as shown in Sections 5.2.1.4 and 5.2.1.5. A variety of well‐known combat aircraft images are shown in Figure 7.27.
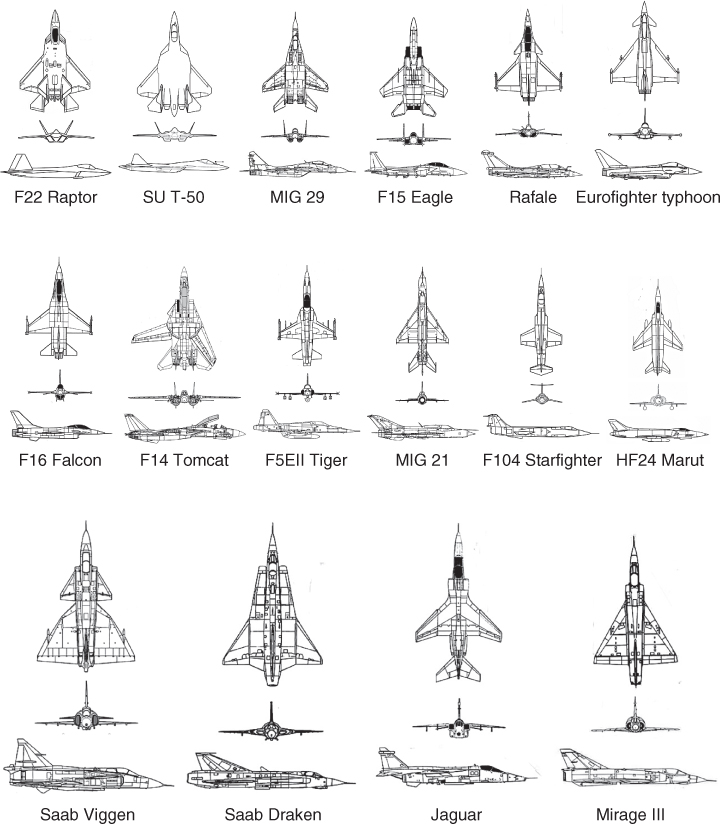
Figure 7.27 Military aircraft fuselage views (not to scale).
Source: Reproduced with permission from Ferrier.
The densely packed fuselage design starts with the nose cone, which has to be pointed for supersonic capability and then houses a radar that could be of around 1 m diameter. Fighter aircraft fuselage would invariably house the power plant and, therefore, there will not be any separate podded nacelle (some older bombers have pods). The necessity for area ruling makes for narrowing of the fuselage. Therefore, the fuselage would rarely have a constant cross‐section, making fuselage shape generation quite complex.
The fuselage aft ends up as an engine exhaust system and therefore will not have closure as in civil design. In case the engine dangles below the fuselage spine (Figure 7.19b – Phantom), then a pointed aft end closure follows. The fuselage belly fairing would be housing accessories, in most cases the undercarriage. Current tendencies are for the wing‐body fairing to have considerable blending for superior aerodynamic considerations, for example, to improve lift to drag ratio and fly at a higher angle of attack. In a blended fuselage it is hard to isolate it, a possible convenient choice would be where the wing root is attached.
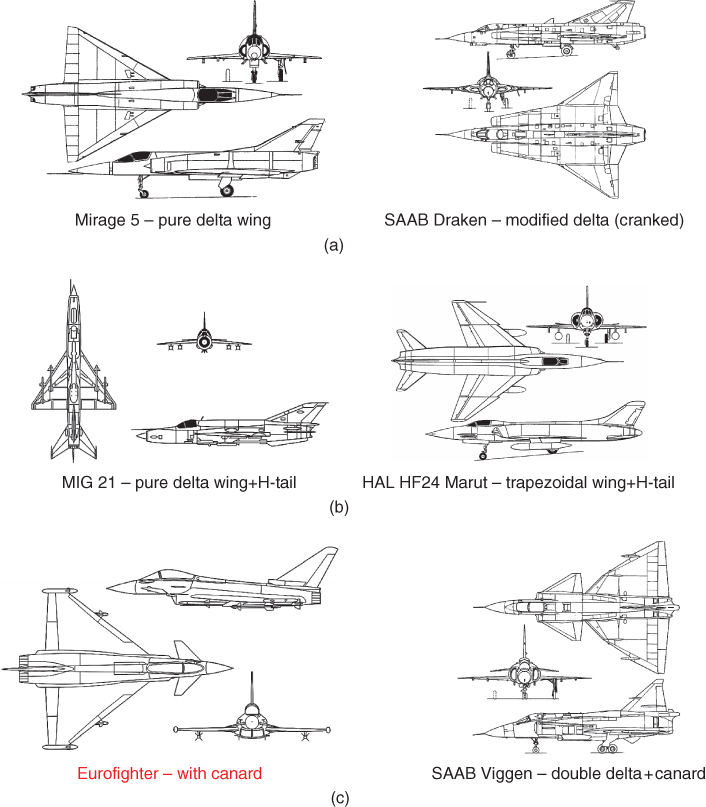
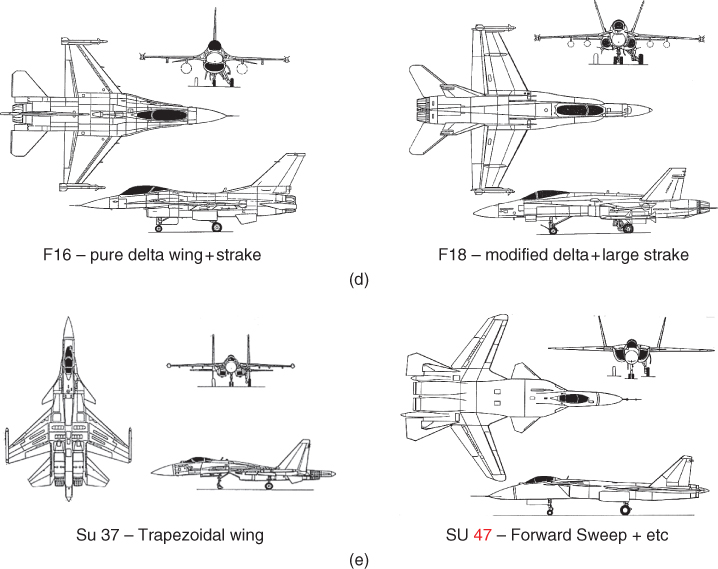
Figure 7.28 Fighter aircraft configurations. (a) One surface wing planform – trailing edge has pitch control, (b) two‐surface wing planform – the conventional H‐tail has pitch control, (c) two‐surface wing planform – canard + wing trailing edge has pitch control, (d) two‐surface wing planform – conventional layout with strakes and (e) three surface wing planform – canard + wing + H‐tail.
Source: Reproduced with permission from Ferrier.
Also, a military aircraft pilot seat has more freedom to recline to shorten carotid artery height to reduce blood starvation to the brain at high g manoeuvres that can cause blackouts.
7.11.2 Wing Group (Military)
The wing group is the most important component of the military aircraft. The wing planform shape needs to be established based on the operational requirements (e.g. hard manoeuvres, supersonic capabilities, short field performances). Unlike civil design, there is a large range of options for planform shape and fuel tankage space is restricted.
The evolution of fighter aircraft shows the dominant delta or short trapezoidal wing planform. This is for obvious reasons of having high leading‐edge sweep and low AR to negotiate high g manoeuvres that would generate a high wing root bending moment. It would restrict span growth but encourage large wing root chord of delta or trapezoid with strake planform as shown in Figure 7.28g,h. For control reasons it could have additional surfaces. The following are the configuration choices (strakes are taken as part of wing):
- One‐surface configuration. Pure delta planform or its variation – the trailing edge of the delta like wing can be made to work like an H‐tail as an integral part of the wing (Figure 7.28a).
- Two‐surface configuration. Delta‐like wing or trapezoidal wing with a conventional H‐tail for pitch control. In some designs, the H‐tail is replaced by a canard surface for pitch control in relaxed stability (has a destabilising effect). A two‐surface configuration has two possibilities – a tail at the back (Figure 7.28b) or a tail in front (canard – Figure 7.28c). A two‐surface configuration with strake is shown in (Figure 7.28d). Variants include the double delta (SAAB Viggen, see Figure 7.28c).
- Three‐surface configuration. The ultimate kind is a three‐surface configuration (Figure 7.28e). It has a wing, H‐tail at the aft end and canard at the front end.
A delta wing trailing edge would have a pitch control surface integrated with it. A trapezoidal wing planform (Figure 7.20c,d) could be associated with a separate pitch control surface, typically as an H‐tail. An extreme form of the three‐surface arrangement exists (Sukhoi 37 – Figure 7.28e). Forward sweep has aerodynamic merits to bring the wing aerodynamic centre to move forward, which favours H‐tail sizing. However, aeroelastic problems could aggravate wing twist creating instability. Carefully arranged composite material has minimised the effect of twist and there are two successful designs that have been flight tested (Su 47, see Figure 7.28e, and Grumann X29).
The role of the canard in military application is quite different from that in the role of civil aircraft designs. It has been found that strakes can also provide additional vortex lift and fast responses to pitch control with a conventional tail. The choice of strake or canard is still not properly researched in the public domain. It is interesting to note that US designs have strakes while the European kinds have canards. Detailed study of aircraft control laws and FBW system architecture is required to make the choice. Until the 1990s, flaws in FBW software have caused several serious accidents.

Figure 7.29 Advanced jet trainer aircraft capable of close support combat. (a) BAe Hawk – proven older design and (b) EADS MAKO.
Source: Reproduced with permission from Ferrier.
Again, it is emphasised that this book is introductory in nature. For not having enough information on modern fighter design considerations, the author restricts military aircraft design exercises to a trainer class of aircraft. The readers will find that there is a lot to learn from this class of aircraft, enough to have a feel for military aircraft design considerations. Figure 7.29 shows the modern Advanced Jet Trainers that have variants for CAS roles. The Ae Hawk is a successful but relatively older design (still in production) that has a conventional configuration. EADS MAKO is one of the latest trainer aircraft designs capable of supersonic flight and light combat capability.
Wing attachment to fuselage varies from case to case. The leading edge can have slats and the trailing edge would invariably have flaps. Centrally mounted large air brakes to decelerate have practically eliminated the role of spoilers. Landing in shorter airfields may require deployment of a brake parachute.
Since military aircraft are expected to encounter transonic flight, aircraft cross‐sectional area distribution becomes an important consideration. A seamless smooth distribution of cross‐section (area‐rule) is explained in Section 3.13.
7.11.3 Empennage Group (Military)
Combat aircraft empennage shaping and sizing are complex procedures, primarily on account of a short tail arm and the need to fly in relaxed stability to execute fast and hard manoeuvres (Chapter 6). The B2 apparently appears to be without a tail. The F22 has a large canted V‐tail. Options for control surface configuration are shown along with wing options. The delta wing has an H‐tail integrated with it. This book adheres to the conventional configuration of H‐ and V‐tail for the trainer aircraft example. Modern designs deploy tailerons (stabilator; see Section 6.5.3) to initiate pitch and roll control by an H‐tail.
Introductory comments expressed the complexity involved in control surface design, which are primarily of the empennage group. Having short tail arms (LHT and LVT) the stability (stabiliser/fin) and control surfaces (elevator/rudder) will necessarily have to be large in relation to the aircraft size to make fast responses. In many designs the vertical tail is split into two (could be placed slightly inclined in a shallow Vee for stealth reasons) as can be seen in the F18. The canted V‐tail of the F22 is on account of stealth considerations. The horizontal tail is symmetrical to the vertical plane and has to be secured on the fuselage – some of the earlier designs had a T‐tail.
Military aircraft control is through FBW technology, which processes control deflection through onboard computers ensuring safety. If the pitch control demand were high requiring flying in relaxed stability, then a canard surface in front of fuselage would prove helpful. The advent of FBW has achieved yaw control without a V‐tail – it is achieved through differential use of an aileron surface that can be split to open up both in upward and downward directions, if required simultaneously. This book will not be discussing control‐configured designs (control‐configured vehicle: CCV) – these would require analysing the control laws, not dealt with here.
Delta wings can have H‐tails integrated within with the reflex built‐in at the trailing edge (Mirage 2000). The exception of an older design is shown in Figure 7.30a (YF12) with two canted vertical tails. The YF12 design paved the way for the current wing and empennage design options. An unconventional empennage exists (Figure 7.30).
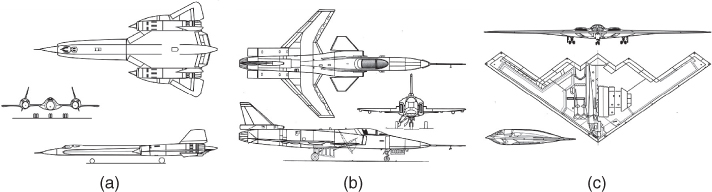
Figure 7.30 Empennage options. (a) SR71 twin tail – inclined, (b) X‐29 separate H‐tail with wing and (c) B2 – tailless.
Source: Reproduced with permission from Ferrier.
The B2 in Figure 7.30 appears to be tailless. Its pitch control is at the inboard trailing edges and directional/lateral controls are carried out by controlled opening of a split aileron in both sides. Much of the future will depend on how many lifting surfaces are used. Typically, a highly manoeuvrable combat aircraft will have a large V‐tail split into two and canted for stealth reasons. Trainer aircraft favour a conventional type with an H‐ and V‐tail.
7.11.4 Intake/Nacelle Group (Military)
Unlike a simpler pod‐mounted configuration of civil aircraft, the military aircraft power plant is kept within the fuselage. Therefore, military aircraft of the combat class do not have nacelles, instead they have an (supersonic) intake that is an integral part of fuselage configuration. Supersonic intake is comparatively more complex to design. A supersonic intake has a side plate acting both as boundary layer bleeder and adjust oblique shock. Intake design requires serious considerations to cater for the full flight envelope to supply air inhalation to the engine without causing flow distortion at the engine face that can cause compressor surge and/or flame‐out problems.
Combat aircraft use the aft fuselage to house the engine. Broader classification (options) of military fighter aircraft engine intake configuration is given in Table 5.1. A large number of intake configuration types are given Figure 5.34.
Single or multi‐engines (so far mostly two) are kept side‐by‐side buried in the fuselage. Fighter aircraft intake path is longer and curvier. Older designs had a forward intake at the nose (MiG21). Aircraft with over Mach 1.8 capability have a centre body (bullet translates forward/backward to adjust bow oblique shock). These have the longest intake duct with low curvature to pass under the pilot and incur high loss, hence they are no longer pursued. Instead, chin (F8 Crusader) or side (Hawk) mounted intakes have shorter ducts and these carefully designed ducts have comparable curvature, hence less loss. A plate is kept above the fuselage boundary layer on which the intake is placed. A centre body is required for aircraft speed capability above Mach 1.8, otherwise it has a pitot intake: trapezoidal slanted side intake (F22). The B2 has over wing/fuselage intakes more suited to the BWB type of configuration.
Some older and odd type engine integration configurations with over the fuselage engine installation are shown in Figure 7.31.
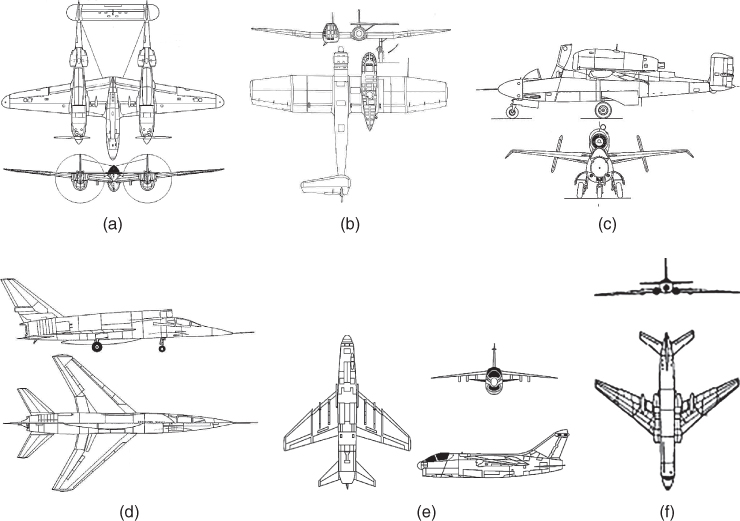
Figure 7.31 Options for engine positions of some older designs. (a) Twin fuselage engines, (b) asymmetric engine B & V141, (c) over fuselage – Heinkel 162, (d) over fuselage – F107, (e) forward intake – Corsair and (f) engines at side of fuselage.
Source: Reproduced with permission from Ferrier.
In summary, intakes on fuselage have following possibilities:
- Central forward intake (invariably circular/MiG21 – can be near circular F100). These are older designs, no longer used in practice. Considerable duct loss is associated with its long length from nose to tail and bends to pass underneath the pilot. For supersonic operation, a centre body arrangement makes diffusion through a series of oblique shocks and a normal shock. The centre intake does not have fuselage shielding at yaw and pitch attitudes.
- Side intakes (semi‐circular, rectangular, e.g. F18 and F22 etc.) – it cuts down the internal duct length by nearly half but associates with bends, which is less for two side‐by‐side engines. It can be over or under the wing. For supersonic operation, there is a splitter plate that bleeds the fuselage boundary layer to keep it outside the intakes. It needs to be carefully sized for flying in yawed attitude.
- Chin mounted intake (near elliptical/kidney shaped like the Falcon F16, near rectangular like Eurofighter). These are later designed aircraft. At yaw, chin intake does not have fuselage shielding as there could be for side intakes, but being close to the ground there could be ground ingestion problems, especially during war time. This concept has proven very successful and can handle high incidence flying.
- Central over fuselage mounted intake (this is opposed to a chin mounted intake like the Predator UCAV aircraft). This configuration is not prevalent – high incidence flying may create serious flow distortion affecting engine performance. This type of configuration is gaining ground, however, on account of stealth considerations.
- Future designs will have stealth features and F22/B2/JUCAS type nacelles will become common shapes of intake design.
7.12 Miscellaneous Comments
Sometimes stability and control necessities require additional surfaces, for example, a ventral fin, dorsal fin, delta fin and so on. Fairings between two intersecting bodies or to enclose protruding objects play an important role as flow modifiers. Vortex generators are placed wherever it is necessary – they are prominently seen on the wing's upper surface. Antennas/ducts can be seen in places as essential features to serve specific purposes. Readers are encouraged to examine real aircraft kept statically on tarmac. Every item seen on the external surface counts and contributes to drag.
In general, during the conceptual design phase, sizing of these features is done schematically. Sizing of trim surfaces becomes more appropriate once the aircraft configuration is frozen. Initially, the control surface sizing is done empirically and by computational fluid dynamics (CFD) analysis in the second phase of study, and gets fine‐tuned by tailoring the surface during flight trials. In this book, trim surfaces are kept schematically – the main task of this book is to size aircraft and freeze the configuration in the first phase of the project.
7.13 Summary of Military Aircraft Design Choices
Building blocks for aircraft configuration are presented in this chapter that will be used in Chapter 8 to configure aircraft. After establishing the specification requirements from market study (Chapter 2), the classroom work could start from Chapter 8 to layout an aircraft configuration using the typical building blocks presented in this chapter. A quick browse through this before starting aircraft layout would prove beneficial. Given next is a quick summary on how to layout military aircraft configuration.
Military Aircraft Layout (approach differs from the civil approach to configuration layout)
- Guesstimate the MTOM from Figure 7.23 (statistical value) for the payload range for the class.
- Pick a wing area from Figure 7.24 for the MTOM. Decide on a single‐, two‐ or three‐surface design (needs aircraft control analysis – in this book, kept as a two‐surface conventional design). Next, decide wing geometry, for example, sweep, taper ratio and t/c for the high‐speed Mach‐number capability.
- Decide on a high‐, mid‐ or low wing from customer requirements. Decide whether the wing should be dihedral or anehedral based on wing position.
- Decide number of engines required – for fighter aircraft this is unlikely to exceed two. In this book the choice is a single engine. The engine is invariably housed in the fuselage.
- Shape the fuselage to house the engine and fit the wing and empennage. Guesstimate the H‐ and V‐tail sizes for the wing area.
Supersonic compressibility effects dictate military aircraft design. It would invariably require reactionary thrust such as offered by jet engines. A sharp pointed nose, large wing sweep with low AR, stealth features and control configured features offer wider options. However, the designers tend to be conservative in approach with pilot survivability as the most dictating consideration, while incorporating newer concepts to stay ahead of perceived threats. As combat technology is heading towards unmanned battlefield operations, relaxed stability flying with FBW will make aircraft fly at higher g beyond human limits. ‘Star Wars’ shapes for UAV aircraft are not an impossibility.
References
- 1. Jane's All the World's Aircraft Manual (yearly publication).
- 2. McCanny, R (2005). Statistics and Trends in Commercial Transport Aircraft. Final Year Project, QUB.
- 3. Roskam, J. (2007). Airplane Design. Volumes 1 to 8.
- 4. Jenkinson, L.R., Simpson, P., and Rhodes, D. (1999). Civil Jet Aircraft Design. Arnold Publishing.
- 5. Yan‐Yee, A. K. (2000). The Role of Constraints and Vehicle Concepts in Transport Design: A Comparison of Cantilever and Strut‐Braced Wing Airplane Concepts, Master's Thesis (April 2000), Virginia Polytechnic Institute and State University.