CHAPTER 18
Stock Options and Stock Index Options
Aims
- To examine stock options and stock index options.
- To show how you can provide a minimum (floor) value for a portfolio of stocks but also be able to capture most of the ‘upside’ if stock prices rise – this is a protective put.
- To show how you can hedge a portfolio of stocks using dynamic delta hedging.
- To show how several options (on the same underlying asset) can be combined to give a risk-free portfolio – this is a ratio spread.
- To demonstrate how you can make a profit from mispriced options, while hedging any changes in market risk.
We have seen in Chapter 17 that investors can use stock options to speculate on the direction of stock price changes and on changes in the volatility of stock returns. Investors can also insure or hedge a cash market position consisting of stocks held in a specific firm (e.g. 50,000 stocks in AT&T) or in certain specific industries (e.g. oil industry) or in a ‘market portfolio’ (e.g. S&P 500) by using various types of stock index options. First we discuss hedging using options on individual stocks and then using stock index options.
18.1 OPTIONS ON STOCKS
If you hold a number of stocks in one particular company (e.g. AT&T) you can alter or eliminate the (market and specific) risk, using options on this stock.
18.1.1 Static Hedge: Covered Call
A static hedge assumes the initial options positions are held to maturity. Suppose an investor holds AT&T stocks. She can offset some of the downside risk by writing (selling) a call – this is a covered call strategy. Downside risk is reduced slightly because the investor receives the call premium:
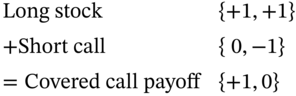
Figure 18.1 shows the payoff to a covered call with ![]() ,
, ![]() and an initial stock price
and an initial stock price ![]() . The profit at maturity, is given by:
. The profit at maturity, is given by:


FIGURE 18.1 Covered call
For ![]() the downside risk is reduced by the amount of the call premium of $3 to a breakeven of $21. However, the upside potential is considerably reduced – the maximum profit is
the downside risk is reduced by the amount of the call premium of $3 to a breakeven of $21. However, the upside potential is considerably reduced – the maximum profit is ![]() .1
.1
18.1.2 Static Hedge: Protective Put
An investor can protect her long stock position but without sacrificing all the upside potential (of holding stocks) by buying a put – this is a protective put (Figure 18.2) also sometimes called a ‘guaranteed bond’ – see Chapter 15.


FIGURE 18.2 Protective put
The payoff profile for the protective put is the same as for a long call. (This is put–call parity again.) Suppose ![]() and the put has
and the put has ![]() and
and ![]() . The profit from the protective put is:
. The profit from the protective put is:

As can be seen in Figure 18.2 the protective put has a lower limit (a ‘floor’) on losses but allows most of the upside capture. The protective put is an insurance contract – in return for the put-premium, a minimum value for the stock is guaranteed at maturity. (Note that for an at-the-money put ![]() , so the ‘floor value’ would be the current value of the stock.)
, so the ‘floor value’ would be the current value of the stock.)
18.1.3 Delta Hedging a Stock Portfolio with Puts
The static protective put does not ensure that the value of the portfolio remains unchanged at all times. Instead, it ensures a minimum value (= K) for the stock+put portfolio, at maturity of the option contract. However, it is possible to continuously hedge a stock+put portfolio. We require any change in the cash-market value of the stocks to be offset by changes in the value of the puts. Suppose you hold ![]() stocks (of AT&T) with price
stocks (of AT&T) with price ![]() , with $-value
, with $-value ![]() . A portfolio of
. A portfolio of ![]() stocks plus
stocks plus ![]() puts is worth:
puts is worth:
where ![]() is the number of stocks underlying each put contract. A dynamically hedged portfolio has to satisfy:
is the number of stocks underlying each put contract. A dynamically hedged portfolio has to satisfy:

If you are long stocks ![]() then as
then as ![]() , the hedge portfolio consists of buying
, the hedge portfolio consists of buying![]() puts. The term ‘
puts. The term ‘![]() ’ is the dollar value of the 100 AT&T stocks deliverable in each put contract. Suppose the investor is long
’ is the dollar value of the 100 AT&T stocks deliverable in each put contract. Suppose the investor is long ![]() = 800 stocks at
= 800 stocks at ![]() = $10, so that
= $10, so that ![]() = $8,000 and assume
= $8,000 and assume ![]() = –0.4. Then
= –0.4. Then ![]() put contracts should be purchased to hedge against (small) changes in the stock price. As the option's delta changes (because of changes in
put contracts should be purchased to hedge against (small) changes in the stock price. As the option's delta changes (because of changes in ![]() , and
, and ![]() ), the number of put option contracts to maintain the delta hedge needs rebalancing over time.
), the number of put option contracts to maintain the delta hedge needs rebalancing over time.
A dynamic hedge for a portfolio of stocks on AT&T using puts, can eliminate the market and specific risk of the AT&T stocks. As the put-delta is only valid for small changes in the stock price, the value of the stock+put portfolio is not hedged against large changes in stock prices (gamma risk) or changes in volatility (vega risk) – these issues are elaborated on in Chapter 28.
18.1.4 Ratio Spread
If you already hold a position in options then you can create a ‘delta neutral’ (i.e. risk-free) options portfolio by combining two (or more) options (on the same underlying asset). The latter possibility also gives rise to a ratio spread whereby traders attempt to make profits from mispriced options (on the same underlying asset).
The analysis below applies to both calls and puts. Two stock options (both on the same underlying) might have different deltas because they have different strike prices or maturity dates. Each option contract is for delivery of ![]() stocks. The value of a portfolio consisting of
stocks. The value of a portfolio consisting of ![]() holdings of option-A and
holdings of option-A and ![]() holdings in option-B (on the same underlying) if the option prices are
holdings in option-B (on the same underlying) if the option prices are ![]() is:
is:
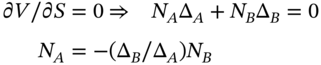
For a zero change in value of the options portfolio:
Suppose we already hold a naked position in ![]() (long) call options, with
(long) call options, with ![]() and we are worried about the risk to our options position from small changes in the stock price. If another call option (on the same underlying) has
and we are worried about the risk to our options position from small changes in the stock price. If another call option (on the same underlying) has ![]() , then a ‘delta neutral’ portfolio requires
, then a ‘delta neutral’ portfolio requires ![]() that is, short 20 calls of option-A. (But if option-A is a put option with
that is, short 20 calls of option-A. (But if option-A is a put option with ![]() , the delta-neutral position would involve buying
, the delta-neutral position would involve buying![]() put options-A).
put options-A).
18.1.5 Underpriced Options
Consider a trader Ms Long, who thinks that call option-B (on Boeing stocks) with ![]() is under-priced by 1% because of stale price quotes. To take advantage of the under-pricing Ms Long could today buy
is under-priced by 1% because of stale price quotes. To take advantage of the under-pricing Ms Long could today buy ![]() of options-B, hoping to close out later at a 1% profit – after the mispricing is corrected.
of options-B, hoping to close out later at a 1% profit – after the mispricing is corrected.
But if the stock market as a whole falls (i.e. S&P 500) then the price ![]() of Boeing stock will also fall, which would produce a fall in the price of call option-B (written on Boeing), and this might eliminate any profit due to Ms Long's position in the ‘underpriced’ option-B.
of Boeing stock will also fall, which would produce a fall in the price of call option-B (written on Boeing), and this might eliminate any profit due to Ms Long's position in the ‘underpriced’ option-B.
In Chapter 16 on delta hedging we noted that Ms Long could create a delta-neutral portfolio by short-selling ![]() stocks of Boeing. If option-B is correctly priced then the hedge position does not change in value (for small rises or falls in
stocks of Boeing. If option-B is correctly priced then the hedge position does not change in value (for small rises or falls in ![]() ). So the delta-hedge protects the value of the (option-B+Boeing-stocks) portfolio, while the investor waits for the option-B's mispricing to be corrected.
). So the delta-hedge protects the value of the (option-B+Boeing-stocks) portfolio, while the investor waits for the option-B's mispricing to be corrected.
But if, as Ms Long believes, option-B is under-priced then when the mispricing is corrected, option-B's price will rise by 1% more than implied by the hedge![]() , Hence, when Ms Long closes her positions in option-B and stocks-B she earns a profit of 1%, even if
, Hence, when Ms Long closes her positions in option-B and stocks-B she earns a profit of 1%, even if ![]() has fallen due to a fall in the market (S&P 500) index.
has fallen due to a fall in the market (S&P 500) index.
To undertake the above arbitrage transaction requires short-selling stock-B.2 This may not be possible because of the ‘uptick rule’ (i.e. in the US you are only allowed to short-sell if the last quote was a price rise), and may be expensive to implement because of high transactions costs (e.g. 50% margin on short-selling in the US plus any ‘haircuts’ demanded by the broker from whom you borrow the stocks and also the risk of a ‘short-squeeze’). However, all is not lost.
The trader can exploit ![]() under-priced calls (on Boeing) by simultaneously selling
under-priced calls (on Boeing) by simultaneously selling ![]() call options-A (also on Boeing) but with different strikes or time to maturity and hence a different delta,
call options-A (also on Boeing) but with different strikes or time to maturity and hence a different delta, ![]() ). This is a ratio spread.
). This is a ratio spread.
If option-A and option-B (both on Boeing) are correctly priced, the ratio spread provides a hedge (for small changes in the stock price of Boeing). However, given that option-B is actually under-priced by 1%, the ratio spread makes a riskless profit of 1%, when option-B eventually rises to its correct (fair) value given by Black–Scholes.3
18.2 STOCK INDEX OPTIONS (SIO)
Stock index options (SIO) are frequently used to hedge the market (systematic) risk of a diversified portfolio of stocks. A fund manager using index options can either obtain insurance or can dynamically hedge the market risk of her portfolio of stocks.
18.2.1 Contract Specification
We focus on the S&P 100 (American style) and the FTSE 100 (European-style) contracts. The S&P 100 (American) index option is often referred to by its ticker symbol (OEX) and is the most actively traded option on CBOE. SIO are settled in cash. If ![]() is the dollar-value of one index point and the current stock index is
is the dollar-value of one index point and the current stock index is ![]() , then the dollar-value of the S&P index is
, then the dollar-value of the S&P index is ![]() . For S&P 100 index options,
. For S&P 100 index options, ![]() (Table 18.1), hence if the S&P 100 index is
(Table 18.1), hence if the S&P 100 index is ![]() , then
, then ![]() . Put slightly differently, if the S&P 100 index changes by one point (e.g. from 1,000 to 1,001) then this implies a change in the value of the S&P index of $100.
. Put slightly differently, if the S&P 100 index changes by one point (e.g. from 1,000 to 1,001) then this implies a change in the value of the S&P index of $100.
TABLE 18.1 S&P 100 (American-OEX) Index Option (CBOE)
Source: CBOE website.
| Unit of trading: | $100 × S&P 100 Index |
| Expiry month: | Four, near term months (plus one additional month from the March quarterly cycle) |
| Min. price movements: | For an option trading below 5, the minimum tick is 0.05 ($5) and for all other series 0.10 ($10) |
| Tick size (& value): | Either 0.05 ($5) or 0.10 ($10) |
| Exercise: | American. May be exercised on any business day before the maturity date. European also available. |
| Settlement day: | Cash settled based on closing index value on the business day of exercise |
| Last trading day: | Business day preceding the expiration date |
| Settlement: | In cash, based on |
The ‘settlement price’ ![]() is the index value at the market close. If, at maturity
is the index value at the market close. If, at maturity ![]() (index points) and the strike price in a put contract is
(index points) and the strike price in a put contract is ![]() (index points), then the holder of a long put receives:
(index points), then the holder of a long put receives:
Call and put premia are quoted in terms of index points. Suppose a quote for the S&P 100, March-950 call is ![]() (index points). This implies that one call contract costs
(index points). This implies that one call contract costs ![]() , hence:
, hence:
Index options are also available on the S&P 500 (a European-style option traded on CBOE), the Major Market Index (traded on AMEX) and the Value Line Index (traded on PHLX) and the NYSE-Composite (traded on NYSE). In the US there are also index options available on industry indices (e.g. oil, utilities).
For the FTSE 100 (European Style) index option (Table 18.2) the value of an index point is set at ![]() . So if the FTSE 100 index is at 6,500 then the value of the index is
. So if the FTSE 100 index is at 6,500 then the value of the index is ![]() . Quotes for option premia are in index points. For example, the April-6500 put on the FTSE 100 (European Style) index option, quoted at
. Quotes for option premia are in index points. For example, the April-6500 put on the FTSE 100 (European Style) index option, quoted at ![]() would have an invoice price of £630
would have an invoice price of £630 ![]() .
.
TABLE 18.2 FTSE 100 (European) Index Option
Source: ICE-Intercontinental Exchange website.
| Unit of trading: | £10 per index point |
| Expiry month: | March, June, September, December (plus additional months so that the nearest 3 calendar months are always available for trading) |
| Min. price movements: | 0.5 (index point) |
| Tick size (& value): | 0.5 (£5) (Min. block trade is 500 contracts) |
| Exercise: | By 18.30 on last trading day only |
| Settlement day: | 1st business day after maturity date |
| Last trading day: | 10.15 (London time) on 3rd Friday of expiry month |
18.2.2 Static Hedge Using Stock Index Options: Protective Put
Suppose you hold a stock portfolio-A with current value ![]() , whose composition mirrors the S&P 100
, whose composition mirrors the S&P 100 ![]() and want to protect its value in 1 year's time. You fear a price fall so you buy index puts with maturity
and want to protect its value in 1 year's time. You fear a price fall so you buy index puts with maturity ![]() . This is a protective put. If the S&P 100 index currently stands at
. This is a protective put. If the S&P 100 index currently stands at ![]() index points, then to insure a diversified portfolio of stocks (with
index points, then to insure a diversified portfolio of stocks (with ![]() ), the number of puts required is (see Appendix 18.A):
), the number of puts required is (see Appendix 18.A):

To insure your stock portfolio at T from all downside risk (given ![]() ) you need to choose ATM-puts with a strike price
) you need to choose ATM-puts with a strike price ![]() . At T, if you lose on your stock portfolio you want to be fully compensated by the payoff from the puts. If the S&P 100 index falls 20% to
. At T, if you lose on your stock portfolio you want to be fully compensated by the payoff from the puts. If the S&P 100 index falls 20% to ![]() , then the value of your stock portfolio falls by $200,000. But if you exercise the puts you make a profit of 200 index points
, then the value of your stock portfolio falls by $200,000. But if you exercise the puts you make a profit of 200 index points ![]() per contract and with 10 contracts the dollar payoff is
per contract and with 10 contracts the dollar payoff is ![]() . The loss on the stock portfolio over the year is exactly offset by the payoff to the puts. If the put premium paid was
. The loss on the stock portfolio over the year is exactly offset by the payoff to the puts. If the put premium paid was ![]() index points, the 10 put contracts cost
index points, the 10 put contracts cost ![]() which is the cost of the insurance.
which is the cost of the insurance.
Let's take a slightly more complex case, where ![]() so that
so that ![]() . The key factor is the choice of strike price in the put. If the S&P 100 index currently stands at
. The key factor is the choice of strike price in the put. If the S&P 100 index currently stands at ![]() and you choose a strike of
and you choose a strike of ![]() , this implies you are willing to accept a fall in the market index of 10%. Hence, the maximum acceptable fall in the value of your stock portfolio is
, this implies you are willing to accept a fall in the market index of 10%. Hence, the maximum acceptable fall in the value of your stock portfolio is ![]() that is $120,000.
that is $120,000.
Suppose the S&P 100 index falls by 20% to ![]() index points, so your stock portfolio falls by 24%,
index points, so your stock portfolio falls by 24%, ![]() . The payoff to the puts is
. The payoff to the puts is ![]() hence, the net outcome from the protective put strategy is a loss of $120,000. This is exactly the loss you were willing to incur when choosing a strike of
hence, the net outcome from the protective put strategy is a loss of $120,000. This is exactly the loss you were willing to incur when choosing a strike of ![]() at the outset.
at the outset.
If the S&P index rises (above K) you do not exercise the puts but the value of your stock portfolio has increased. In this case the ‘insurance’ provided by the put was not needed but of course insurance does not come ‘free’ – as you pay the put premium. This is a static stock-put hedge because we have assumed the option contract is held to maturity. It provides a ‘floor’ for the value of the stock portfolio but also allows most of the upside potential.
18.2.3 Dynamic Delta Hedge Using Stock Index Options
Assume you hold ![]() (dollars) in a diversified stock portfolio-A with beta
(dollars) in a diversified stock portfolio-A with beta ![]() (with respect to the S&P 100 ‘market index’). The change in value of portfolio-A is
(with respect to the S&P 100 ‘market index’). The change in value of portfolio-A is ![]() . To preserve the value of our stock portfolio over a small interval of time, we use a dynamic hedging strategy of stocks+puts. It can be shown (see Appendix 18.B) that the number of index puts to delta-hedge stock portfolio-A is:
. To preserve the value of our stock portfolio over a small interval of time, we use a dynamic hedging strategy of stocks+puts. It can be shown (see Appendix 18.B) that the number of index puts to delta-hedge stock portfolio-A is:

Equation (18.11) implies that if you are long a portfolio of stocks, then to delta-hedge you go long (buy)![]() index puts. Note that the cost of setting up the protective put is
index puts. Note that the cost of setting up the protective put is ![]() and there will be transactions costs of rebalancing the portfolio as the delta of the option changes over time. We discuss dynamic hedging in Chapter 27.
and there will be transactions costs of rebalancing the portfolio as the delta of the option changes over time. We discuss dynamic hedging in Chapter 27.
18.3 SUMMARY
- Options are available on individual stocks (e.g. AT&T, Coca-Cola), broad groups of stocks (e.g. index of oil stocks) and on broad market indexes (e.g. S&P 100, S&P 500, FTSE 100, Russell 2000).
- A static stock-put hedge provides a minimum (floor) value for a portfolio of stocks and also allows upside gains if stock prices are high, at maturity of the option.
- A dynamic stock-put delta hedge ensures that any gains (losses) on the stock portfolio over a small interval of time are offset by losses (gains) on the puts. Hence, over a small interval of time there is no change in the value of the ‘stock+put’ portfolio. A dynamic delta hedge requires frequent rebalancing.
- Ratio spreads allow traders to delta hedge an existing option position using ‘other’ options with different strikes or time to maturity (but on the same underlying asset). If an option is mispriced, then a ratio spread can be used to hedge the position, while waiting for the mispricing to be corrected.
APPENDIX 18.A: STATIC HEDGE: INDEX PUTS
You have ![]() in portfolio-A of stocks, with
in portfolio-A of stocks, with ![]() . If the S&P 100 stock index is currently
. If the S&P 100 stock index is currently ![]() and you choose an index put with a strike
and you choose an index put with a strike ![]() , this implies the acceptable maximum dollar-loss on your portfolio of stocks is
, this implies the acceptable maximum dollar-loss on your portfolio of stocks is ![]() (and hence the minimum (floor) value required is $880,000).
(and hence the minimum (floor) value required is $880,000).
To calculate ![]() consider the outcome at maturity of the put. If the S&P 100 stock index falls to
consider the outcome at maturity of the put. If the S&P 100 stock index falls to ![]() (at expiration of the put option) then the actual loss on your stock portfolio is
(at expiration of the put option) then the actual loss on your stock portfolio is ![]() . The payoff from
. The payoff from ![]() index puts is
index puts is ![]() where
where ![]() per index point. Hence, for
per index point. Hence, for ![]() we choose the number of puts so that:
we choose the number of puts so that:
The payoff from the 12 long puts is ![]() so that Equation (18.A.1) is satisfied. The actual loss on the stock portfolio is $240,000, the payoff from the puts is $120,000 which gives a net loss of $120,000, which equals your maximum acceptable loss set by your choice of strike price,
so that Equation (18.A.1) is satisfied. The actual loss on the stock portfolio is $240,000, the payoff from the puts is $120,000 which gives a net loss of $120,000, which equals your maximum acceptable loss set by your choice of strike price, ![]() .
.
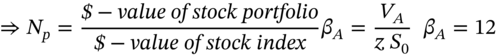
Equation (18.A.2) is often described as follows. The number of index units held in the stock portfolio is ![]() . If
. If ![]() then the number of index units held in puts should therefore also equal
then the number of index units held in puts should therefore also equal ![]() . But as each index point is worth
. But as each index point is worth ![]() , and the stock portfolio beta
, and the stock portfolio beta ![]() may not be equal to one, then the required
may not be equal to one, then the required ![]() is given by (18.A.2).
is given by (18.A.2).
APPENDIX 18.B: DYNAMIC DELTA HEDGE
A diversified stock portfolio consists of ![]() different stocks-i with prices
different stocks-i with prices ![]() . The value of portfolio-A consisting of
. The value of portfolio-A consisting of ![]() -stocks is
-stocks is ![]() hence:
hence:
where ![]() is the return on portfolio-A,
is the return on portfolio-A, ![]() is the return on stock-i and
is the return on stock-i and ![]() is proportion held in each stock-i. Assume, portfolio-A has a market beta
is proportion held in each stock-i. Assume, portfolio-A has a market beta ![]() with respect to the S&P 100 market index,
with respect to the S&P 100 market index,![]() . To preserve the value of the stock portfolio over a small interval of time, we use a dynamic hedging strategy with stocks+puts. The value of the hedge portfolio is
. To preserve the value of the stock portfolio over a small interval of time, we use a dynamic hedging strategy with stocks+puts. The value of the hedge portfolio is ![]() , hence:
, hence:
where ![]() . Substituting
. Substituting ![]() , the return on the S&P 100 ‘market index’ (which is the underlying in the put contract) and
, the return on the S&P 100 ‘market index’ (which is the underlying in the put contract) and ![]() then from (18.B.2):
then from (18.B.2):

EXERCISES
Question 1
If the initial stock price is ![]() and the call premium is
and the call premium is ![]() show the payoff and profits at maturity for a covered call. Is a covered call strategy risk free?
show the payoff and profits at maturity for a covered call. Is a covered call strategy risk free?
Question 2
A pension fund has to pay out a ‘lump sum’ to its pensioners in 6 months' time.
Why might the pension fund (which holds a diversified portfolio of stocks), purchase index puts, with 6 months to maturity, that are currently 3% out of-the-money (OTM)?
Question 3
What is a protective put? Why is the payoff (profile) to a protective put, qualitatively like the payoff to a long call?
Question 4
What is the payoff profile (at expiration) and the breakeven strike price for a portfolio consisting of an equal number of long stocks and long puts? The puts have ![]() and
and ![]() . What is the profit at expiration of the puts, if
. What is the profit at expiration of the puts, if ![]() Assume the initial stock price is
Assume the initial stock price is ![]() .
.
Question 5
The current stock price is ![]() . A put with a strike of
. A put with a strike of ![]() (with 6 months to maturity) is available at a price of
(with 6 months to maturity) is available at a price of ![]() . In a table, show the payoff and profit from a protective put for outcomes at maturity of
. In a table, show the payoff and profit from a protective put for outcomes at maturity of ![]() and
and![]() . What is the breakeven stock price (which gives zero profit)? Who might use a protective put?
. What is the breakeven stock price (which gives zero profit)? Who might use a protective put?
| Stock price (Note: K = 98) |
Payoff Long stock and long put | Profit |
Question 6
You hold a portfolio of ![]() stocks of Coca-Cola with current price
stocks of Coca-Cola with current price ![]() . A put option on Coca-Cola is available with
. A put option on Coca-Cola is available with ![]() , put premium
, put premium ![]() and a delta of
and a delta of ![]() . (Each put is written on
. (Each put is written on ![]() stocks). How would you delta-hedge your stock position and what would happen to the value of your stock-put portfolio if stock prices rise by $2 over the next day?
stocks). How would you delta-hedge your stock position and what would happen to the value of your stock-put portfolio if stock prices rise by $2 over the next day?
Question 7
You hold a position in ![]() put options (on stock-A), with market price
put options (on stock-A), with market price ![]() and
and ![]() . Assume each put option is written on
. Assume each put option is written on ![]() stocks. You believe these puts are underpriced by 1% because you think volatility will increase in the future – although all other options traders believe volatility will not change).
stocks. You believe these puts are underpriced by 1% because you think volatility will increase in the future – although all other options traders believe volatility will not change).
-
- How can you take advantage of the underpricing of the put options, while protecting yourself against the change in the put premium, due to unexpected changes in the stock price?
- If the stock price falls by $2 over the next day and the underpricing of the put is not corrected, what is the outcome of your strategy? Explain.
- If the stock price falls by $2 and the underpricing of the put option of 1% is corrected, what is the outcome of your strategy? Explain.
- What are the risks in your strategy?
NOTES
- 1 The payoff profile of the covered call is equivalent to a written put (with the same strike and time to maturity as the call) plus cash of
 – this is a consequence of put–call parity,
  .
. - 2 Instead of using stocks, the options can also be delta hedged using futures contracts on Boeing stocks, which may involve lower transactions costs and there are no problems with shorting futures contracts.
- 3 We are ignoring other (gamma and vega) risks in this strategy, which we deal with when discussing the other ‘Greeks’ in Chapter 28.