
10.2.6 The Rate-Limiting Step
When heterogeneous reactions are carried out at steady state, the rates of each of the three reaction steps in series (adsorption, surface reaction, and desorption) are equal to one another:
However, one particular step in the series is usually found to be rate-limiting or rate-controlling. That is, if we could make this particular step go faster, the entire reaction would proceed at an accelerated rate. Consider the analogy to the electrical circuit shown in Figure 10-12. A given concentration of reactants is analogous to a given driving force or electromotive force (EMF). The current I (with units of Coulombs/s) is analogous to the rate of reaction, ![]() (mol/s · g cat), and a resistance Ri is associated with each step in the series. Because the resistances are in series, the total resistance is just the sum of the individual resistances, for adsorption (RAD), surface reaction (RS), and desorption (RD). The current, I, for a given voltage, E, is
(mol/s · g cat), and a resistance Ri is associated with each step in the series. Because the resistances are in series, the total resistance is just the sum of the individual resistances, for adsorption (RAD), surface reaction (RS), and desorption (RD). The current, I, for a given voltage, E, is
![]()
Figure 10-12. Electrical analog to heterogeneous reactions.

Since we observe only the total resistance, Rtot, it is our task to find which resistance is much larger (say, 100 Ω) than the other two resistances (say, 0.1 Ω). Thus, if we could lower the largest resistance, the current I (i.e., ![]() ), would be larger for a given voltage, E. Analogously, we want to know which step in the adsorption–reaction–desorption series is limiting the overall rate of reaction.
), would be larger for a given voltage, E. Analogously, we want to know which step in the adsorption–reaction–desorption series is limiting the overall rate of reaction.
The approach in determining catalytic and heterogeneous mechanisms is usually termed the Langmuir–Hinshelwood approach, since it is derived from ideas proposed by Hinshelwood7 based on Langmuir’s principles for adsorption. The Langmuir–Hinshelwood approach was popularized by Hougen and Watson8 and occasionally includes their names. It consists of first assuming a sequence of steps in the reaction. In writing this sequence, one must choose among such mechanisms as molecular or atomic adsorption, and single- or dual-site reaction. Next, rate laws are written for the individual steps as shown in the preceding section, assuming that all steps are reversible. Finally, a rate-limiting step is postulated, and steps that are not rate-limiting are used to eliminate all coverage-dependent terms. The most questionable assumption in using this technique to obtain a rate law is the hypothesis that the activity of the surface is essentially uniform as far as the various steps in the reaction are concerned.
Example of Adsorption Limited Reaction
An example of an adsorption-limited reaction is the synthesis of ammonia from hydrogen and nitrogen,
![]()
over an iron catalyst that proceeds by the following mechanism.9
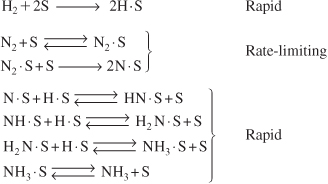
The rate-limiting step is believed to be the adsorption of the N2 molecule as an N atom.
Example of Surface Reaction Limited
An example of a surface-limited reaction is the reaction of two noxious automobile exhaust products, CO and NO,
![]()
carried out over a copper catalyst to form environmentally acceptable products, N2 and CO2:

Analysis of the rate law suggests that CO2 and N2 are weakly adsorbed, i.e., have infinitesimally small adsorption constants (see Problem P10-9B).
10.3 Synthesizing a Rate Law, Mechanism, and Rate-Limiting Step
We now wish to develop rate laws for catalytic reactions that are not diffusion-limited. In developing the procedure to obtain a mechanism, a rate-limiting step, and a rate law consistent with experimental observation, we shall discuss a particular catalytic reaction, the decomposition of cumene to form benzene and propylene. The overall reaction is
![]()
A conceptual model depicting the sequence of steps in this platinum-catalyzed reaction is shown in Figure 10-13. Figure 10-13 is only a schematic representation of the adsorption of cumene; a more realistic model is the formation of a complex of the π orbitals of benzene with the catalytic surface, as shown in Figure 10-14.
Figure 10-13. Sequence of steps in a reaction-limited catalytic reaction.

Figure 10-14. π-orbital complex on surface.

The nomenclature in Table 10-3 will be used to denote the various species in this reaction: C = cumene, B = benzene, and P = propylene. The reaction sequence for this decomposition is shown in Table 10-3.
Table 10-3. Steps in a Langmuir–Hinshelwood Kinetic Mechanism

Equations (10-22) through (10-24) represent the mechanism proposed for this reaction.
When writing rate laws for these steps, we treat each step as an elementary reaction; the only difference is that the species concentrations in the gas phase are replaced by their respective partial pressures:
![]()
There is no theoretical reason for this replacement of the concentration, CC, with the partial pressure, PC; it is just the convention initiated in the 1930s and used ever since. Fortunately, PC can be calculated directly from CC using the ideal gas law (i.e., PC = CCRT).
The rate expression for the adsorption of cumene as given in Equation (10-22) is
rAD = kAPCCυ – k–ACC · S

![]()
![]()
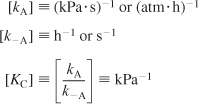
If rAD has units of (mol/g cat · s) and CC · S has units of (mol cumene adsorbed/g cat), then typical units of kA, k–A, and KC would be
The rate law for the surface reaction step producing adsorbed benzene and propylene in the gas phase,
![]()
is
rS = kSCC · S – k–SPPCB · S

![]()
with the surface reaction equilibrium constant being
![]()
Typical units for kS and KS are s–1 and kPa, respectively.
Propylene is not adsorbed on the surface. Consequently, its concentration on the surface is zero.
CP · S = 0
The rate of benzene desorption [see Equation (10-24)] is
![]()
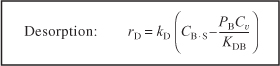
![]()
Typical units of kD and KDB are s–1 and kPa, respectively. By viewing the desorption of benzene,
![]()
from right to left, we see that desorption is just the reverse of the adsorption of benzene. Consequently, as mentioned earlier, it is easily shown that the benzene adsorption equilibrium constant KB is just the reciprocal of the benzene desorption constant KDB:
![]()
and Equation (10-28) can be written as
![]()
Because there is no accumulation of reacting species on the surface, the rates of each step in the sequence are all equal:
![]()
For the mechanism postulated in the sequence given by Equations (10-22) through (10-24), we wish to determine which step is rate-limiting. We first assume one of the steps to be rate-limiting (rate-controlling) and then formulate the reaction rate law in terms of the partial pressures of the species present. From this expression we can determine the variation of the initial reaction rate with the initial total pressure. If the predicted rate varies with pressure in the same manner as the rate observed experimentally, the implication is that the assumed mechanism and rate-limiting step are correct.